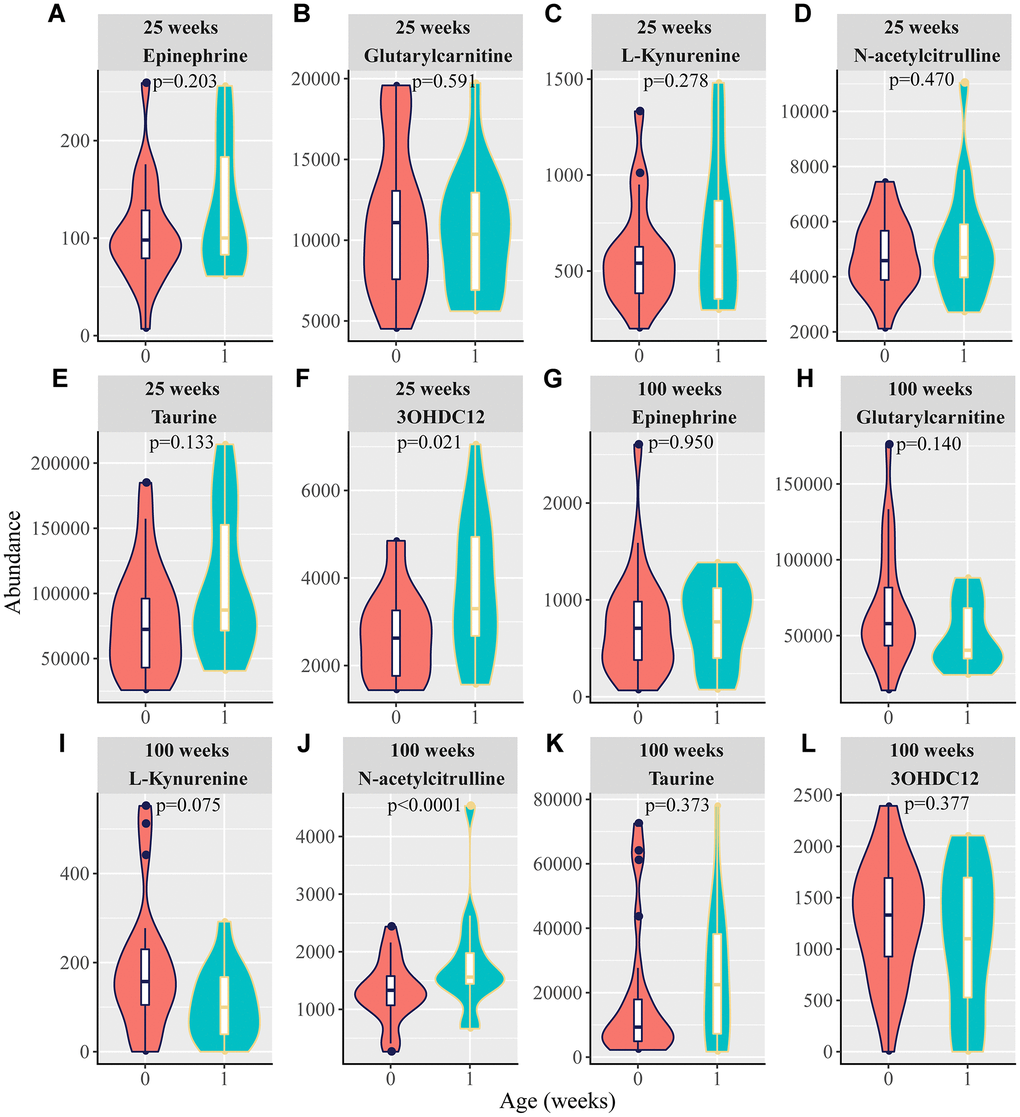
Figure 5.Violin plots for the six potential biomarkers abundance between tumor-free rats and predicting tumor-bearing rats or tumor-bearing rats. At 25 weeks, 0 and 1 in the X-axis are represented as tumor-free rats and tumor-bearing rats, respectively. At 100 weeks, 0 and 1 in the X-axis are represented as tumor-free rats and tumor-bearing rats, respectively. (A–F) Normalized abundance of metabolites in both the negative and positive modes at 25 weeks, including (A) epinephrine, (B) glutarylcarnitine, (C) L-kynurenine, (D) N-acetylcitrulline, (E) taurine, and (F) 3-hydroxydodecanedioic acid (3OHDC12). (G–L) Normalized abundance of metabolites in both the negative and positive modes at 100 weeks, including (G) epinephrine (H) glutarylcarnitine, (I) L-kynurenine, (J) N-acetylcitrulline, (K) taurine, and (L) 3-hydroxydodecanedioic acid (3OHDC12). (p < 0.05 was considered statistically significant; t-test).