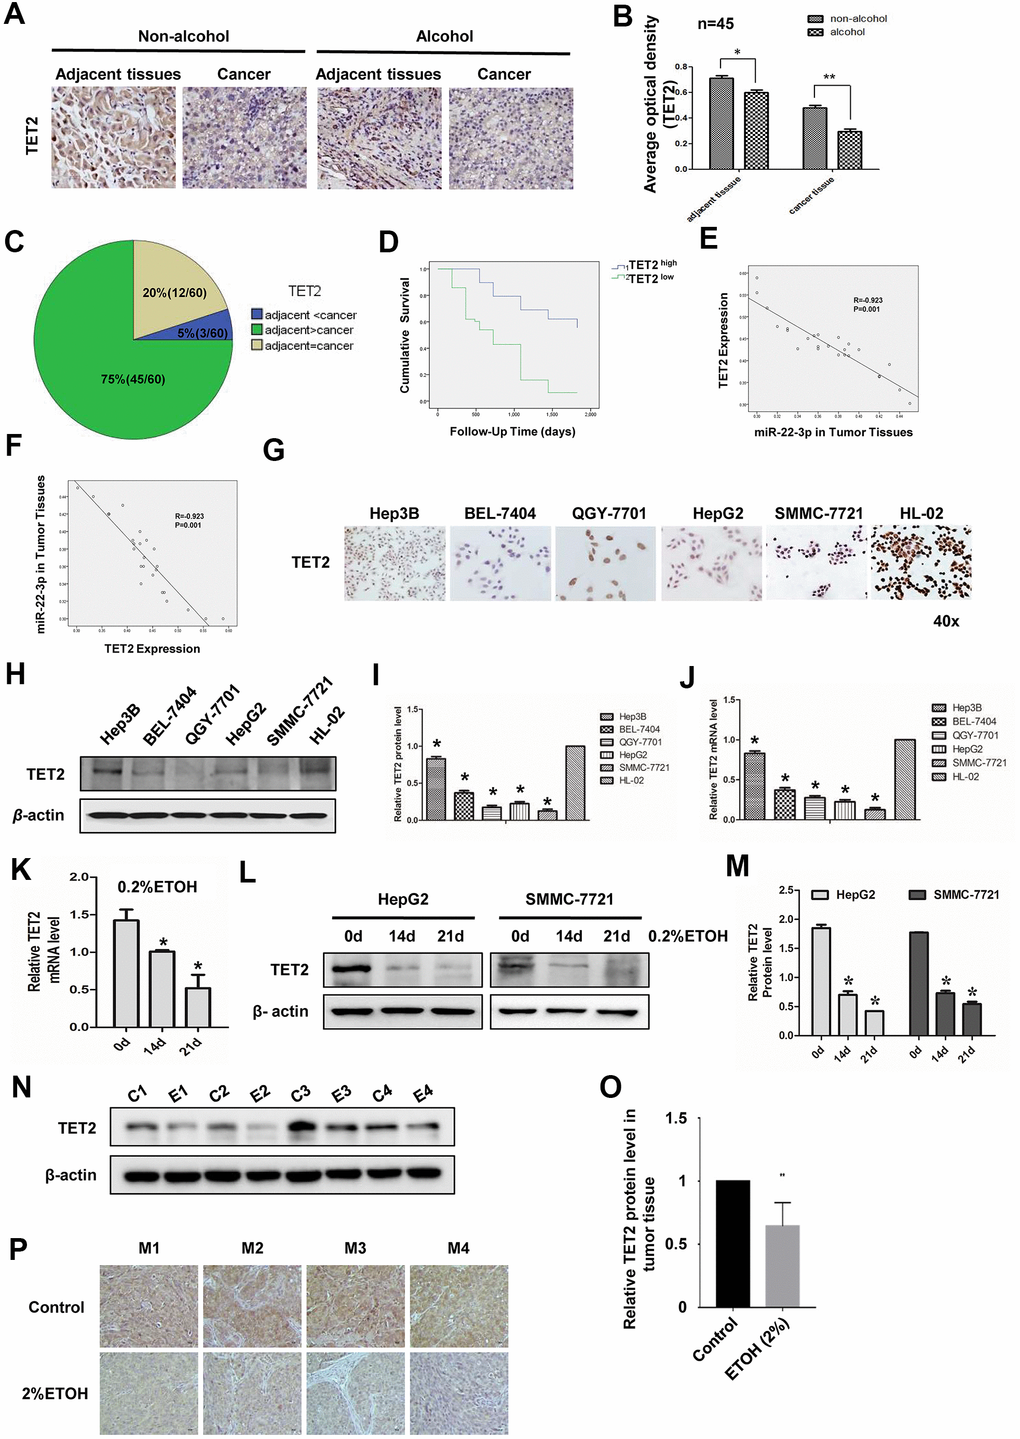
Figure 4.Expression of TET2 in HCC tissues and cell lines with or without alcohol exposure. (A) IHC detection of TET2 protein in adjacent and cancerous tissues of HCC patients with or without alcohol consumption history. Original magnification, ×400. (B) B is the quantification of A, n=45. (C) Statistical analysis of TET2 protein expression in adjacent and cancerous tissues of 60 HCC specimens. (D) Survival curve of HCC patients in TET2 high expression and low expression group. (E) Co-relationship analysis of miR-22-3p and TET2. R= -0.923, P= 0.001. (F) Co-relationship analysis of TET2 and miR-22-3p. R= -0.923, P= 0.001. (G) Protein level of TET2 in HCC cells and normal liver cells by cell IHC. Hep3B, BEL-7404, QGY-7701, HepG2 and SMMC-7721 are hepatocellular carcinoma cells while HL-02 is normal liver cells. (H) Protein level of TET2 in HCC cells and normal liver cells by Western blotting. (I) I is the quantification of H. (J) The relative mRNA level of TET2 in HCC cells and normal liver cells. (K) The mRNA expression levels of TET2 in HepG2 cells treated with 0.2% v/v alcohol for 0, 14, or 21 days. (L) The protein level of TET2 in HepG2 or SMMC-7721 cells treated with 0.2% v/v alcohol for 0, 14, or 21 days. (M) The protein level was quantified and shown in column graph. *P< 0.05, n = 3. (N) The protein level of TET2 in orthotopic liver tumors from the control group and alcohol drinking nude mice was analyzed by WB. Each group consisted of four mice. (O) The protein level of TET2 in N was quantified and shown in column graph. *P< 0.05, n = 4. (P) The protein level of TET2 in orthotopic liver tumors from the control group and alcohol drinking nude mice was analyzed by IHC. Each group consisted of four mice.