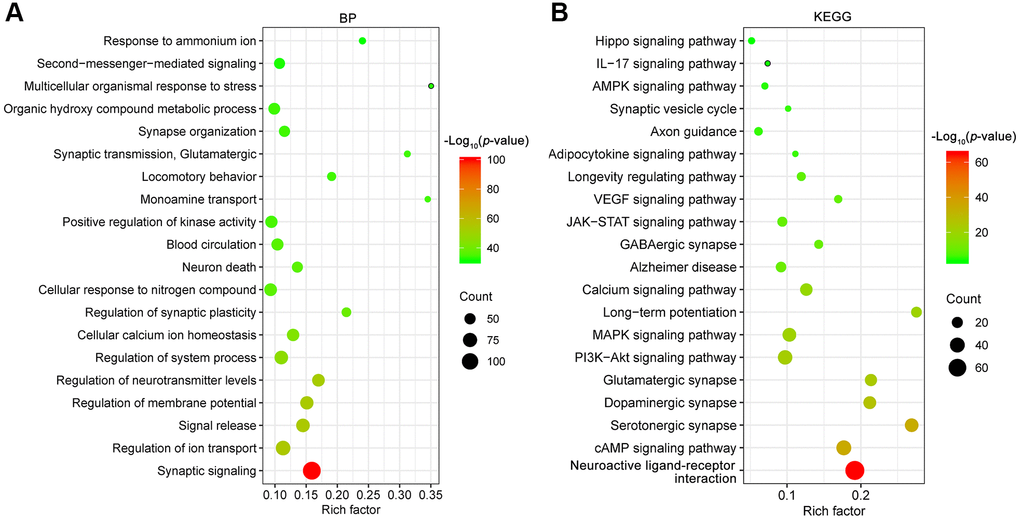
Figure 2.GO biological process (BP, A) and KEGG (B) pathway enrichment analysis of depression targets. The X-axis represents the rich factor, bubble size represents the count of targets enriched in terms and the color represents the p value.
Figure 2 — Mechanistic insights into the anti-depressant effect of emodin: an integrated systems pharmacology study and experimental validation | Aging