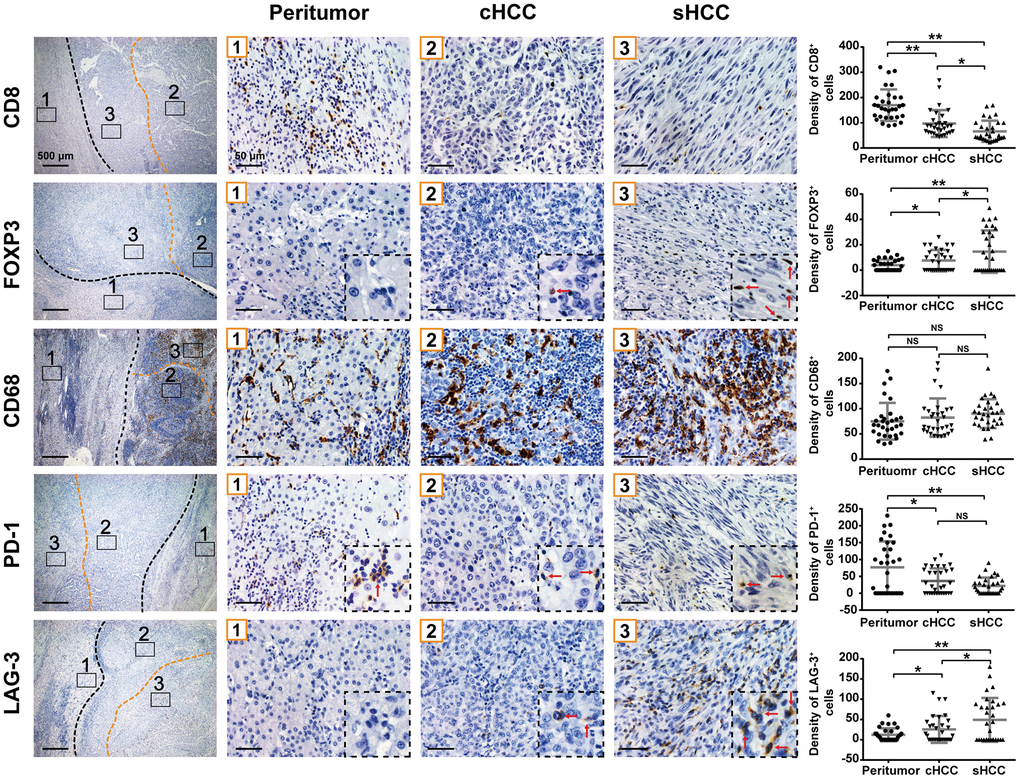
Figure 2.CD8+, FOXP3+, CD68+, PD-1+, and LAG-3+ cell densities (cells/mm2) in the sarcomatoid components, conventional HCC components and peritumor components are shown. Graph: cell densities of each region are indicated in dot plot. *p< 0.05, **p< 0.01. NS, not significant.