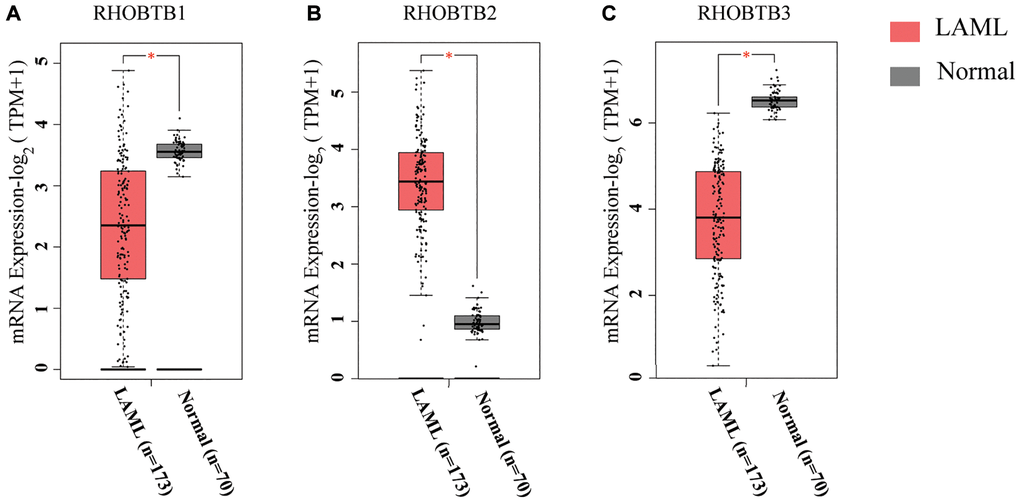
Figure 1.RHOBTB mRNA expression levels in patients with AML (GEPIA2). Box plots show the expression profiles of RHOBTB1 (A), RHOBTB2 (B), and RHOBTB3 (C) in bone marrow samples of patients in the TCGA-AML cohort (n = 173) compared to those in normal matched samples (n = 70) from GTEx. The transcriptional levels were log-normalized by the log2(TPM+1) method. A t-test was used to compare the differences in expression between tumor and normal tissues. *P < 0.05.