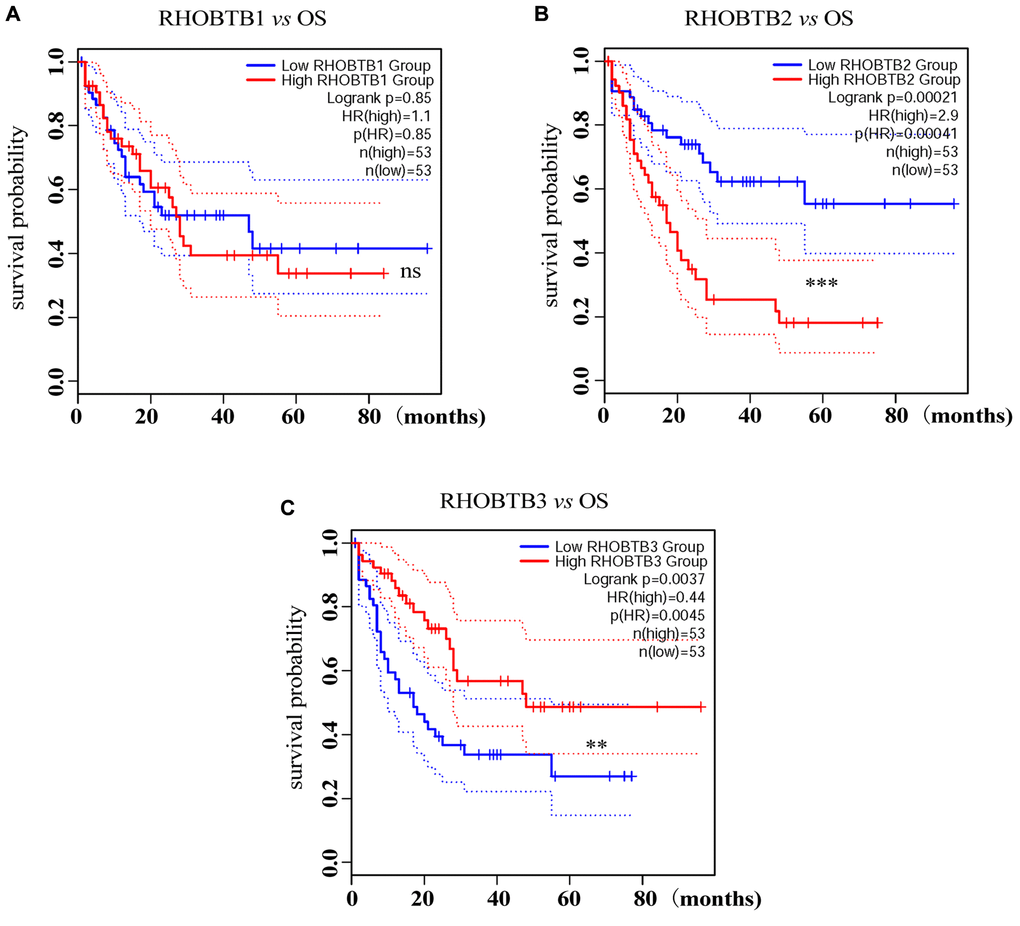
Figure 2.Prognostic analysis of RHOBTB gene expression in AML patients (GEPIA2). Survival analysis was performed based on the mRNA expression levels of RHOBTB1 (A), RHOBTB2 (B), and RHOBTB3 (C) and survival status in the TCGA-AML cohort (106 patients were analyzed) via GEPIA2. Kaplan-Meier (KM) curves were plotted with P-values and HRs by log-rank tests and Cox regression models. Dotted lines indicate the 95% CI. Gene expression levels were dichotomized, generating a high expression group (solid red line) and a low expression group (solid blue line), based on the median expression level of each gene as the cut-off value. OS, overall survival. HR, hazard ratio. CI, confidence interval. **P < 0.01. ***P < 0.001. ns, not significant.