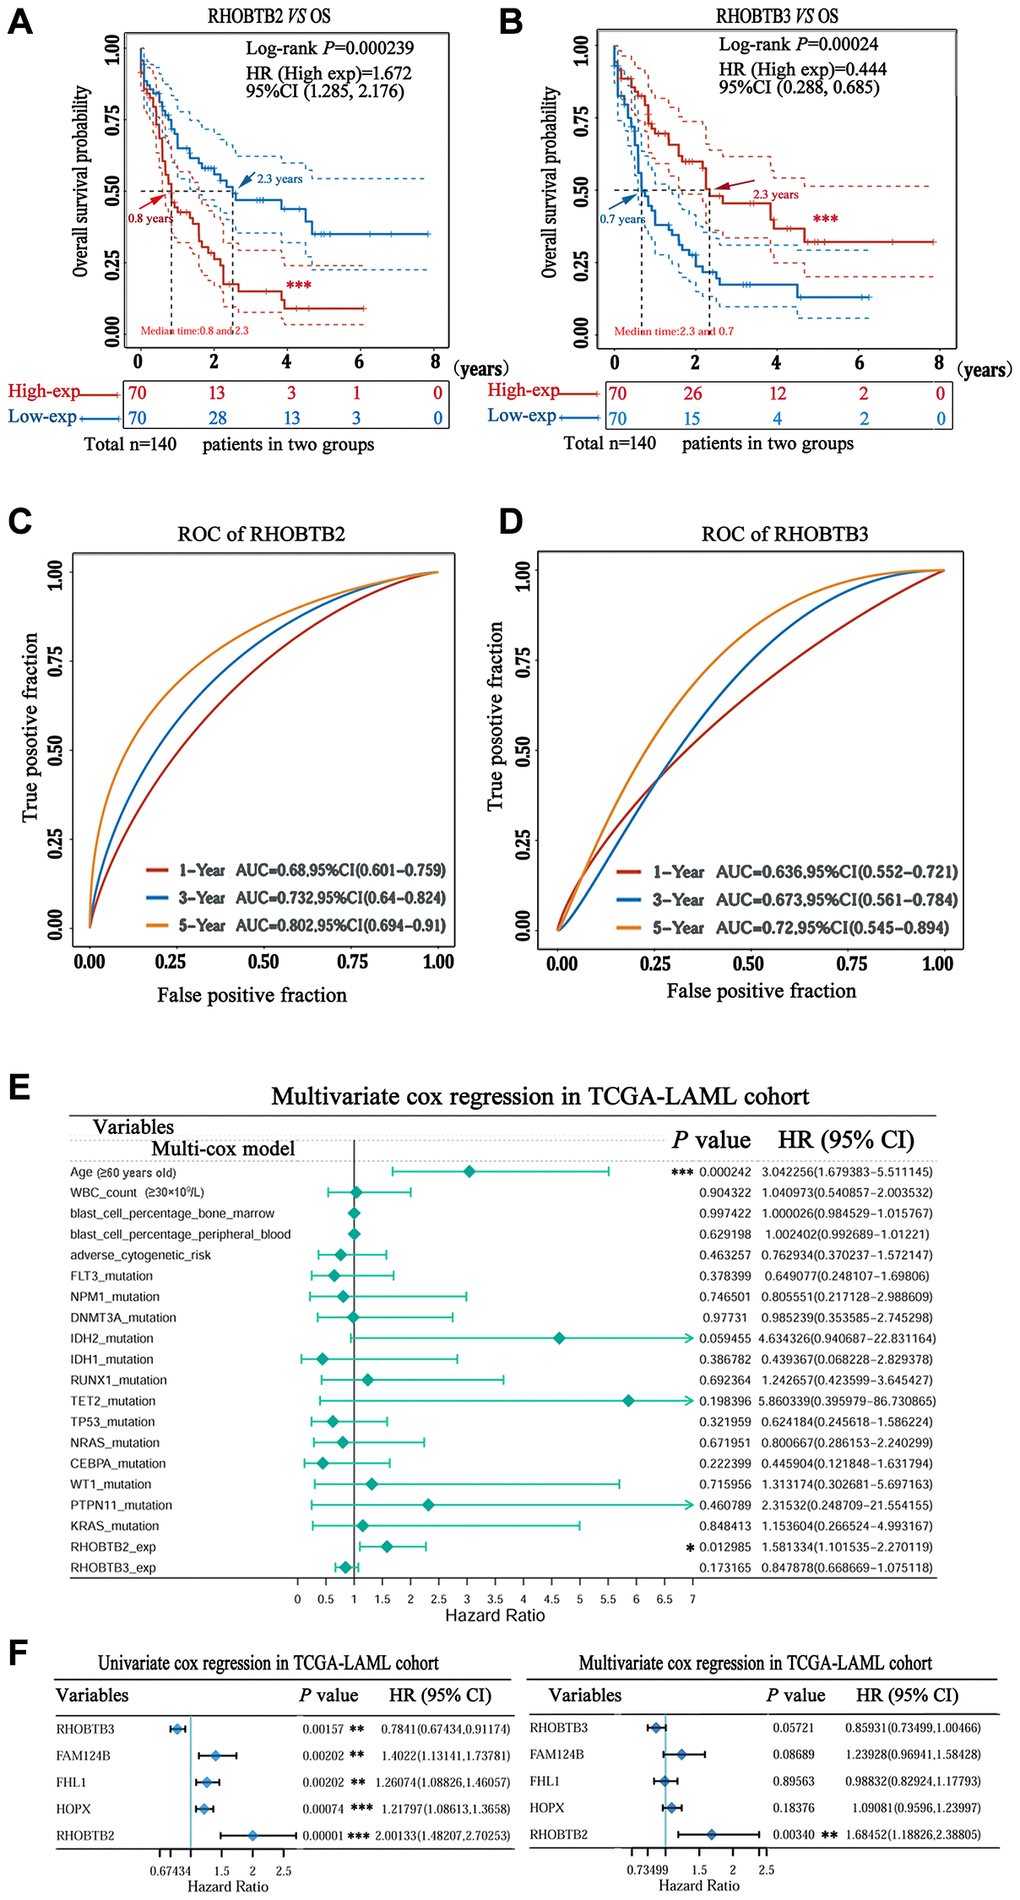
Figure 3.Prognostic value of RHOBTB2 and RHOBTB3 in the TCGA-LAML cohort. Kaplan-Meier survival analysis of RHOBTB2 (A) and RHOBTB3 (B) in AML patients. P-values and hazard ratios (HRs) with 95% confidence intervals (95%CIs) were generated along with log-rank tests and univariate Cox proportional hazards regression. Dotted lines indicate the 95%CI. The survival probability of a total of 140 patients from the LAML cohort was computed after case-wise deletion. Patients were grouped by a dichotomization method based on the median expression level of each gene. Solid red lines represent the high expression groups while solid blue lines represent the low expression groups. Red and blue arrows indicate the median survival time of the two groups, respectively. (C–D) Time-dependent ROC analysis was performed for the 1-, 3-, 5-year time points to determine the predictive accuracy of RHOBTB2 and RHOBTB3. AUC values represent the prediction ability in 1-, 3-, 5-year OS. ROC, receiver operating characteristic. AUC, area under the curve. (E) Multivariate Cox regression analyses of RHOBTB2, RHOBTB3, and clinical features in the TCGA-LAML cohort. The forest plots were generated with the P-values, HR, and 95% CI of each variable through ‘forestplot’ R package. (F) Univariate and multivariate Cox regression analyses of RHOBTB2, RHOBTB3, and three other potential prognosis-related genes (FHL1, HOPX, and FAM124B). A P-value < 0.05 was considered statistically significant. Asterisks represent levels of significance (*P < 0.05, **P < 0.01, and ***P < 0.001).