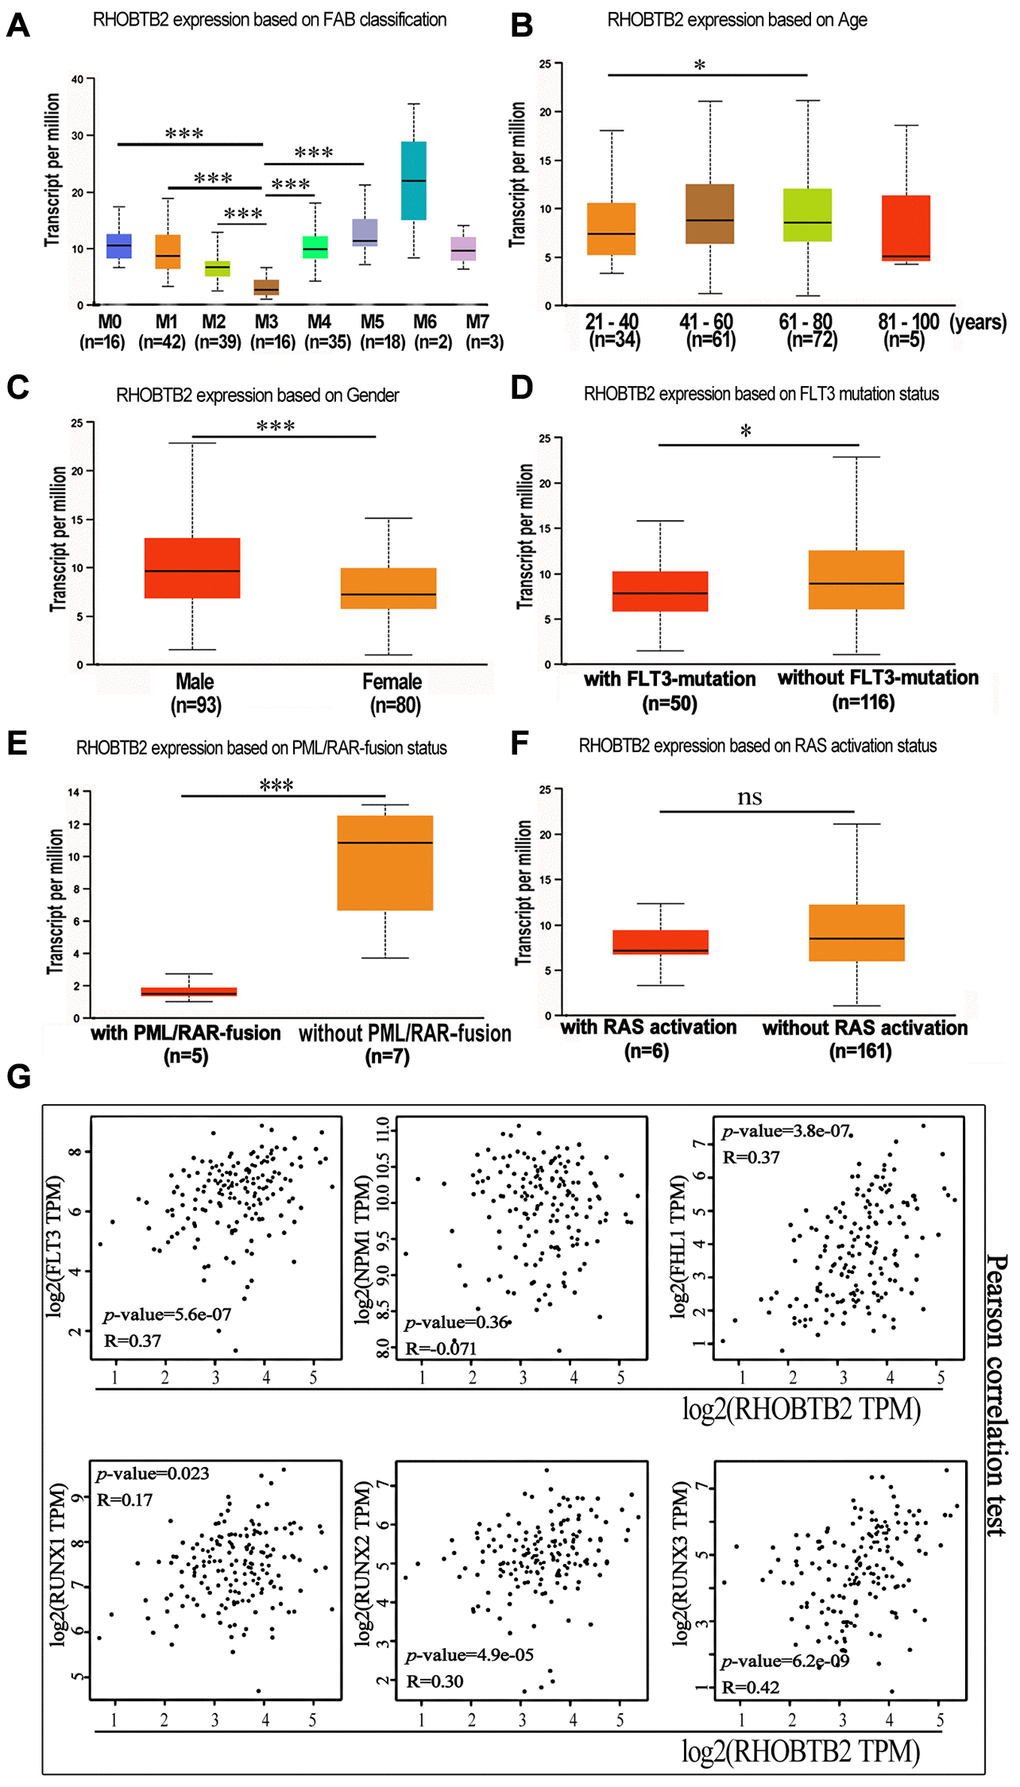
Figure 4.The mRNA expression levels of RHOBTB2 in various classes of AML (UALCAN) and the correlations between RHOBTB2 and disease-related genes in the TCGA-LAML cohort (GEPIA2). (A) Box plots representing RHOBTB2 expression levels in different French–American–British (FAB) subtypes. (B–F) Box plots representing RHOBTB2 expression levels in subgroups based on age (B), gender (C), FLT3 mutation (D), PML/RAR-fusion (E), and RAS activation status (F). (G) The scatter plots show the correlation between RHOBTB2 and disease-related genes such as FLT3, NPM1, FHL1, and RUNX1-3 according to Pearson’s correlation analysis (GEPIA2). A non-log scale of mRNA expression levels was used for calculation and a log2-scale axis was used for visualization. R values indicate correlation coefficients. A P-value < 0.05 was considered statistically significant. *P < 0.05, **P < 0.01, ***P < 0.001, ns, not significant.