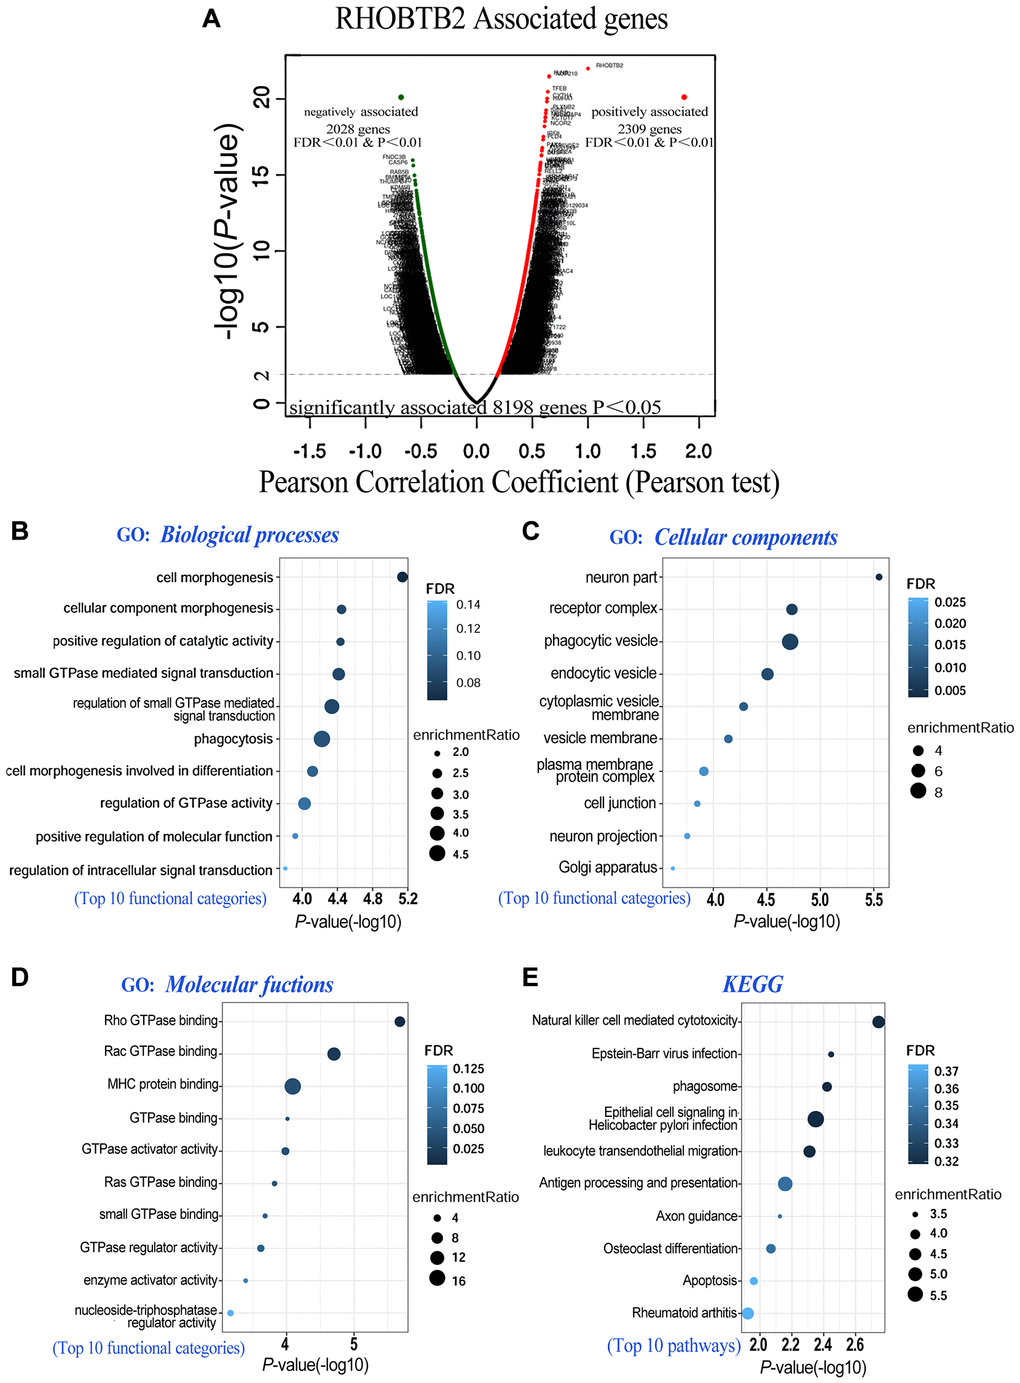
Figure 5.Co-expressed genes of RHOBTB2 (LinkedOmics) and functional enrichment analyses in AML (WebGestalt). (A) Genes positively and negatively correlated with RHOBTB2 in AML were indicated by the volcano plot. Red dots in the right sector represent positively correlated genes, while green dots in the left sector are negatively correlated genes. A total of 8,198 genes with significant associations were defined (P < 0.05), among which there were 2,309 positively associated genes and 2,028 negatively associated genes when FDR < 0.01 and P-value < 0.01 were used as thresholds. Pearson’s test was used to identify the correlations in the TCGA-LAML cohort (n = 173). Bubble plots display the functional enrichment results of GO analysis in terms of biological processes (B), cellular components (C), molecular functions (D) and KEGG signaling pathways (E). The top 10 functional categories and pathways were annotated with color gradient bubbles of different sizes. A (-log10) P-value>1.3 (P-value < 0.05) was considered statistically significant. FDR, false discovery rate.