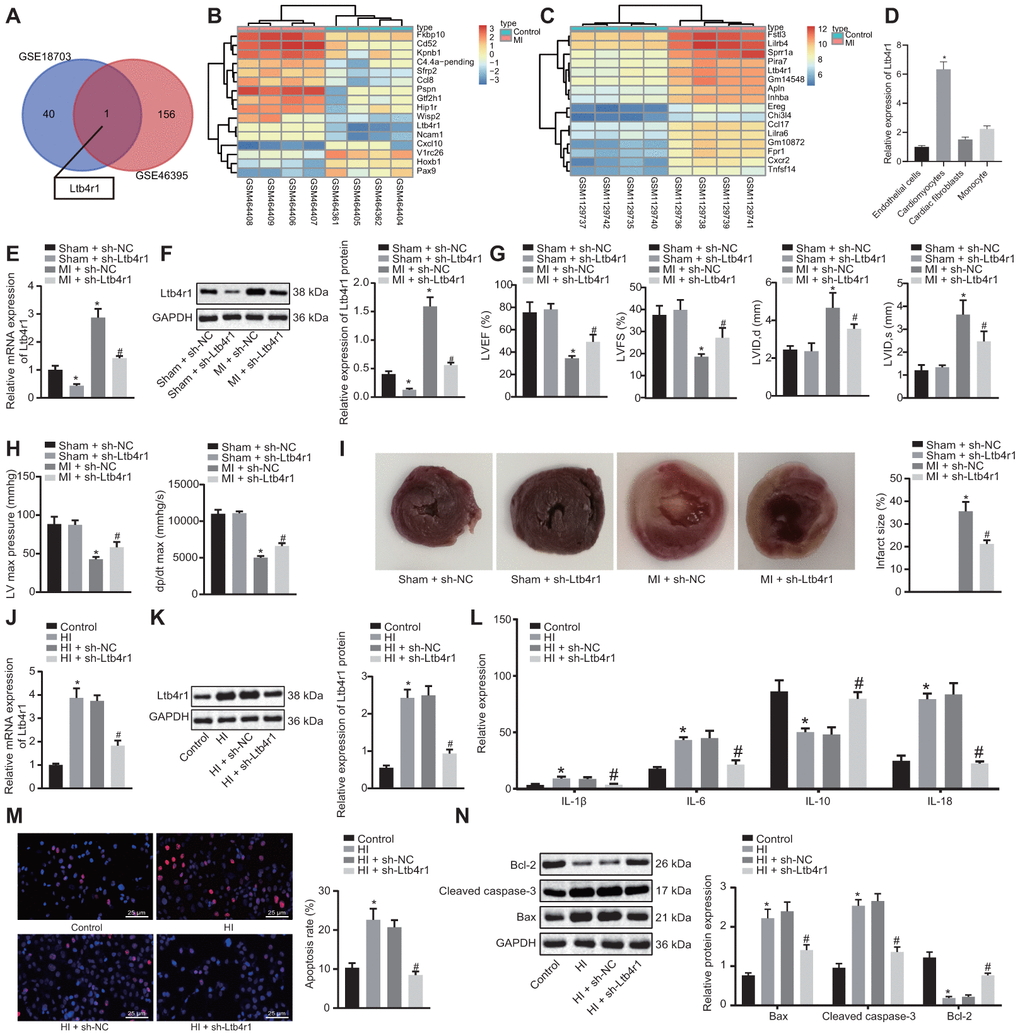
Figure 1.Ltb4r1 expression elevates in myocardial tissues of MI mice following CHD and silencing Ltb4r1 ameliorated CHD-related myocardial injury. (A) Screening of common differentially expressed genes in microarray data GSE18703 and GSE46395 retrieved from the GEO database (https://www.ncbi.nlm.nih.gov/geo/). (B) Ltb4r1 expression in MI mice injected with sh-Ltb4r1 analyzed by microarray data GSE18703. (C) Ltb4r1 expression in MI mice injected with sh-Ltb4r1 analyzed by microarray data GSE46395. (D) Ltb4r1 expression in cardiomyocytes, CFs, endothelial cells, and PBMSCs determined by RT-qPCR. (E) Ltb4r1 expression in myocardial cells of mice determined by RT-qPCR. (F) Ltb4r1 protein level in myocardial cells of MI mice determined using Western blot analysis, normalized to GAPDH. (G) Echocardiography of LVIDD, LVIDs, LVEF, LVFS, in myocardial tissues of MI mice. (H) Hemodynamic analysis of LV and dP/dt in myocardial tissues of MI mice. (I) The infarct size in myocardial tissues of MI mice detected using TTC staining. Hypoxia-induced MI cardiomyocytes treated with sh-Ltb4r1. (J), Ltb4r1 mRNA level in hypoxia-induced MI cardiomyocytes determined using RT-qPCR, normalized to GAPDH; (K) Ltb4r1 protein level in hypoxia-induced MI cardiomyocytes determined using Western blot analysis, normalized to GAPDH. (L) Levels of IL-1β, IL-6, and IL-18 in hypoxia-induced MI cardiomyocytes measured using ELISA. (M) Apoptosis of hypoxia-induced MI cardiomyocytes detected using TUNEL staining (× 400). (N) Protein levels of Cleaved caspase-3, Bax, and Bcl-2 in hypoxia-induced MI cardiomyocytes determined using Western blot analysis, normalized to GAPDH. * p < 0.05 vs. sham-operated mice injected with sh-NC or normal mice and # p < 0.05 vs. MI cardiomyocytes treated with sh-NC or hypoxia-induced MI cardiomyocytes treated with sh-NC. Data among groups were analyzed by one-way ANOVA/Tukey’s test.