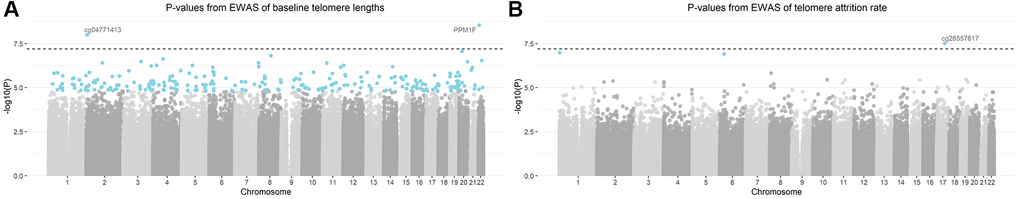
Figure 2.Manhattan plots of -log10 transformed p-values from the epigenome-wide association analysis (EWAS). Models were adjusted for gestational age, newborns’ sex, ethnicity and birth weight, maternal age, pre-pregnancy body-mass-index, parity, presence of pregnancy complications, education level and smoking status, paternal age and estimated blood cell counts. CpGs highlighted in blue were significant based on a false discovery rate of 5%. CpG annotated with gene names (or CpG probe names in case that no gene name annotation was available) were the CpGs passing Bonferroni threshold (the dashed horizontal line) of 6.35 × 10⁻⁸. (A) Manhattan plot of baseline telomere length; (B) Manhattan plot of telomere attrition rate.