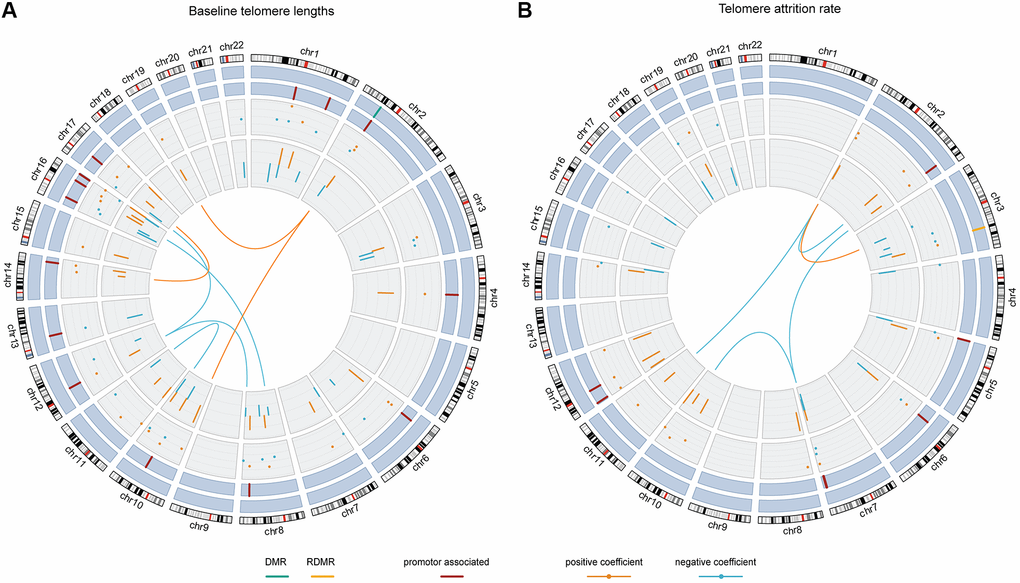
Figure 3.The chord diagrams depicting the contributing weights (final model coefficients) and EWAS associations of the selected CpGs and CpG-CpG interactions with annotations. Chromosomes 1 to 22 are displayed clockwise beginning from the top. Tracks from the outside to the inside represent: chromosome ideograms, whether a CpG is involved in known differentially methylated region (DMR, in green) or reprogramming-specific DMR (RDMR, in yellow), whether a CpG is associated with a promotor region (in dark red), the contributing weights in the final models (dots), the epigenome-wide association analysis (EWAS) associations (segments) and the interaction between CpGs, respectively. Panel (A) shows the results for baseline telomere length and panel (B) for telomere attrition rate. The EWAS coefficients (dots) were shown with dashed grids: in (A) the five grids from inside to outside represent -36, -18, 0, 18, 36; in (B) the five grids from inside to outside indicate -3, -2, -1, 0, 1, 2. Similarly, the model coefficients (segments) were also shown on dashed grids, with the inner to outside grids indicating value -0.02, -0.01, 0, 0.01, 0.02 in (A) and -0.003, -0.002, -0.001, 0, 0.001 and 0.002 in (B), respectively. Coefficients larger than 0 are shown in orange and those smaller than 0 are shown in blue.