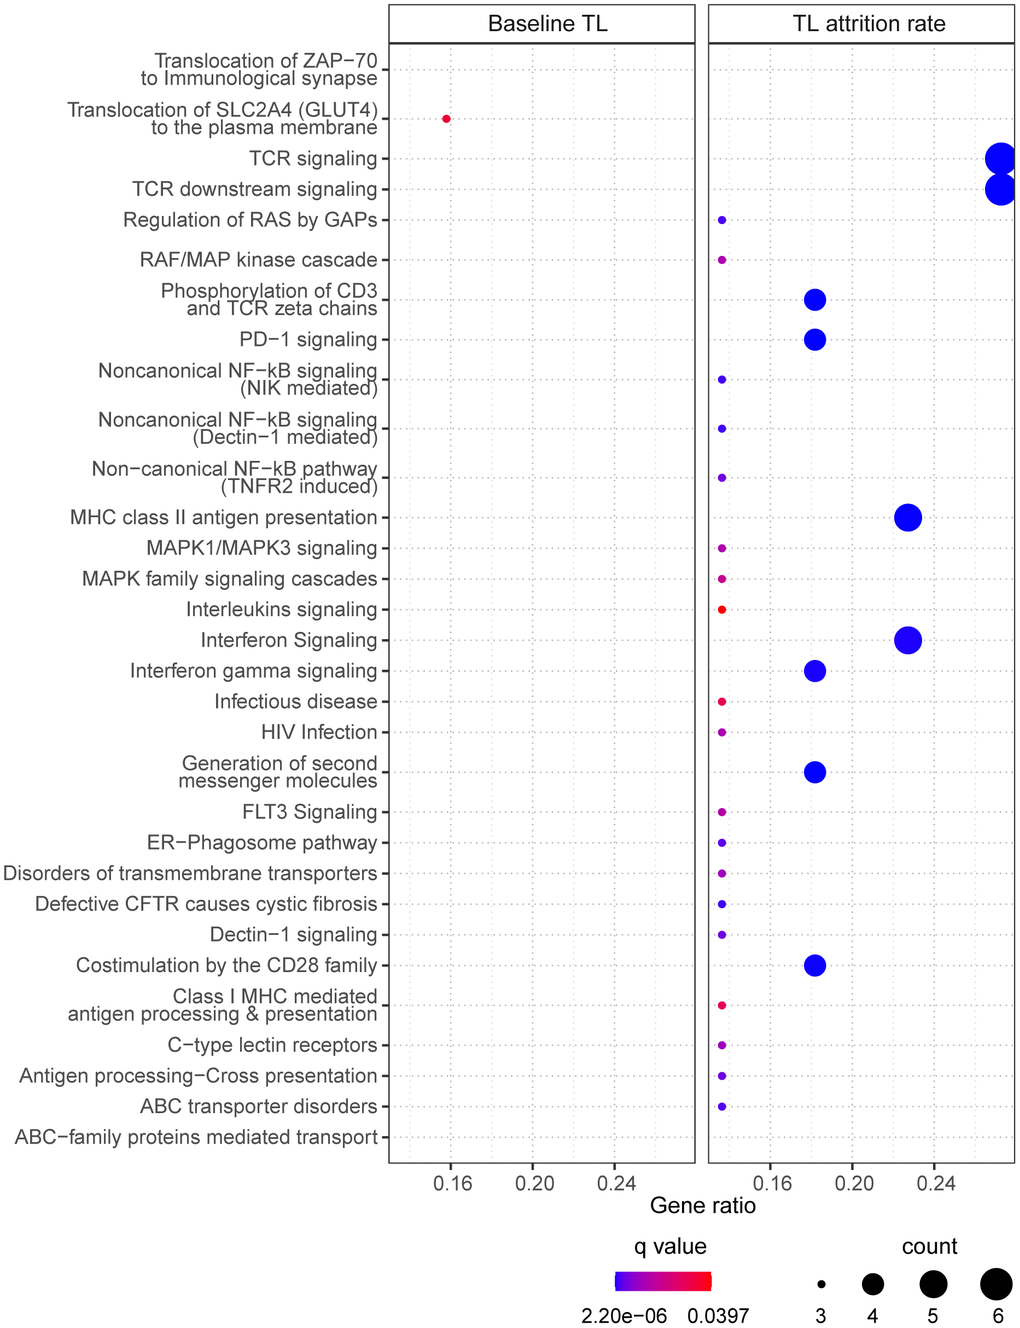
Figure 4.The enriched pathways from the selected CpGs. For baseline telomere length (TL) (left panel), pathways were identified based on CpGs in the final model. For telomere attrition rate (right panel), pathways were identified based on gene transcriptome correlated with the selected CpGs in the final model. Dot size indicates the number of genes (count) in the query list appearing in a pathway. Gene ratio of each pathway was calculated as the count divided by the total number of genes in the pathway. Dot color shows the over-representation analysis q-value.