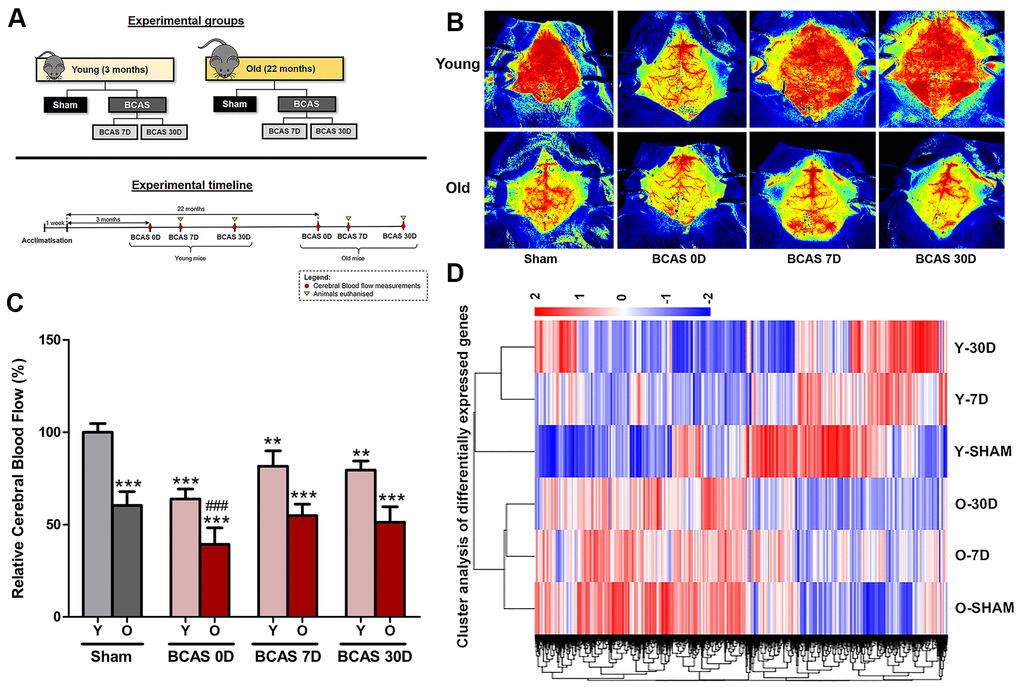
Figure 1.Effect of bilateral common carotid artery stenosis (BCAS) on cerebral blood flow and the respective gene expression profile in young and old mice. (A) Experimental model and timelines of blood flow measurements and tissue collection. Laser speckle contrasting imaging was used to monitor the cerebral blood perfusion in real time for all experimental groups before and after insertion of microcoils through BCAS surgery. (B, C) Representative contrast images and quantification of basal cerebral blood flow for young and old mice before surgery, and effective blood flow levels after 0, 7 and 30-days of BCAS (BCAS 0D, BCAS 7D and BCAS 30D respectively). The cerebral blood flow for the different experimental groups was compared to the normalised baseline (Y-Sham) and further comparisons within the different experimental groups were also performed. The relative cerebral blood flow data are presented in percentage upon calculation of the rate of blood flow in perfusion units (PU) (Refer to methods). Data are represented as mean ± S.E.M. n = 5 mice in each experimental group. **P<0.01 compared to Y-Sham; ***P<0.001 compared to Y-Sham; ###P<0.001 compared to O-Sham. (D) Heatmap of differentially expressed genes in Old Sham (OSham), Old 7 Day (O7D) BCAS, Old 30 Day (O30D) BCAS, Young Sham (YSham), Young 7 Day(Y7D) BCAS and Young 30 Day(Y30D) BCAS, groups with upregulated genes in red and downregulated genes in blue. The colour scale represents the log 10 (FPKM + 1) value.