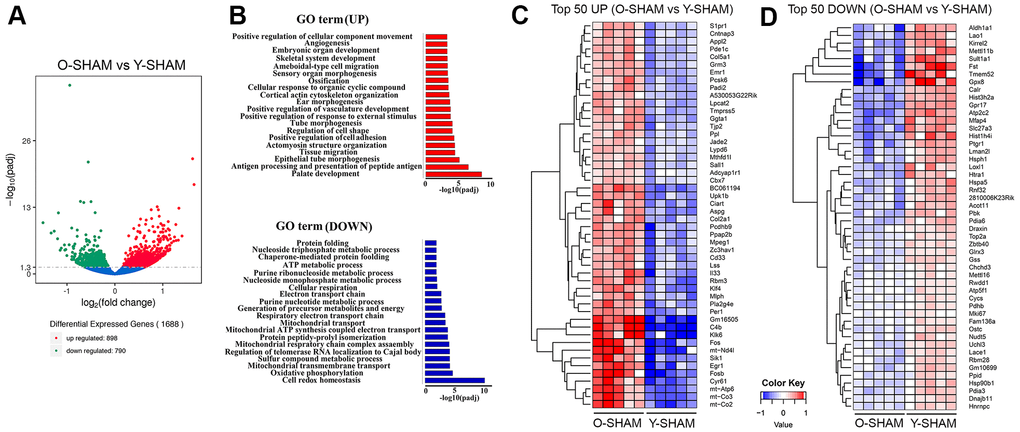
Figure 2.Analysis of differentially expressed genes in young and old hippocampus and their enriched GO terms. (A) Volcano plot of differentially expressed genes analyzed in old Sham group against young Sham group. The threshold of differential expression is q-value < 0.05. The horizontal axis is the log2 fold change of genes. The vertical axis is statistical significance scaled as -log 10 q-value. Each dot represents an individual gene (blue: no significant difference; red: upregulated expression of gene; green: down-regulated expression of gene). (B) The selection of significantly enriched top upregulated and down-regulated GO terms are presented for old Sham against young Sham animals (q < 0.05). The horizontal axis represents the -log10 scale for q-value of each GO term. (C) Top 50 up-regulated genes in old Sham against young Sham animals. (D) Top 50 down-regulated genes in old Sham against young Sham animals. Up-regulated genes in red and down-regulated genes in blue. The color scale represents the log10 (average FPKM+0.5) value.