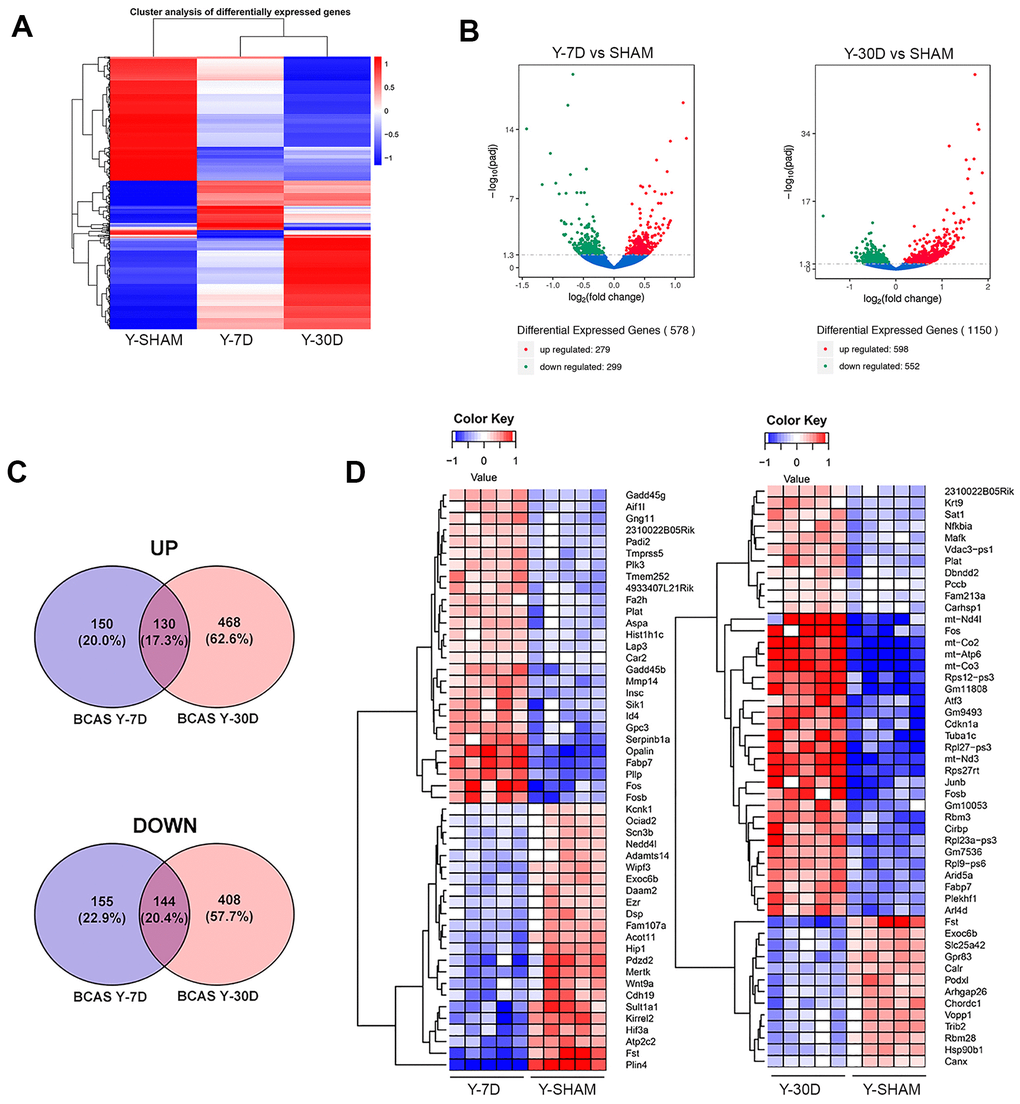
Figure 3.Differentially expressed genes in young hippocampus following chronic hypoperfusion. (A) Hierarchical clustering analysis of differentially expressed mRNA transcripts following 7 and 30 days BCAS compared to Sham animals. Upregulated genes in red and downregulated genes in blue. The color scale represents the log10 (average FPKM+1) value. (B) Volcano plots of differentially expressed genes analyzed in young 7 day and young 30 day BCAS animals compared to Sham animals. The threshold of differential expression is q value < 0.05. The horizontal axis is the log2 fold change of transcripts. The vertical axis is statistical significance scaled as -log 10 q-value. Each dot represents an individual transcript (blue: no significant difference; red: upregulated expression of gene; green: downregulated expression of gene). (C) Top 50 upregulated genes in young 7 day and young 30 day BCAS animals compared to Sham animals. (D) Venn diagram reflects the distribution of differentially expressed genes from 7 day and 30 day BCAS and Sham comparisons.