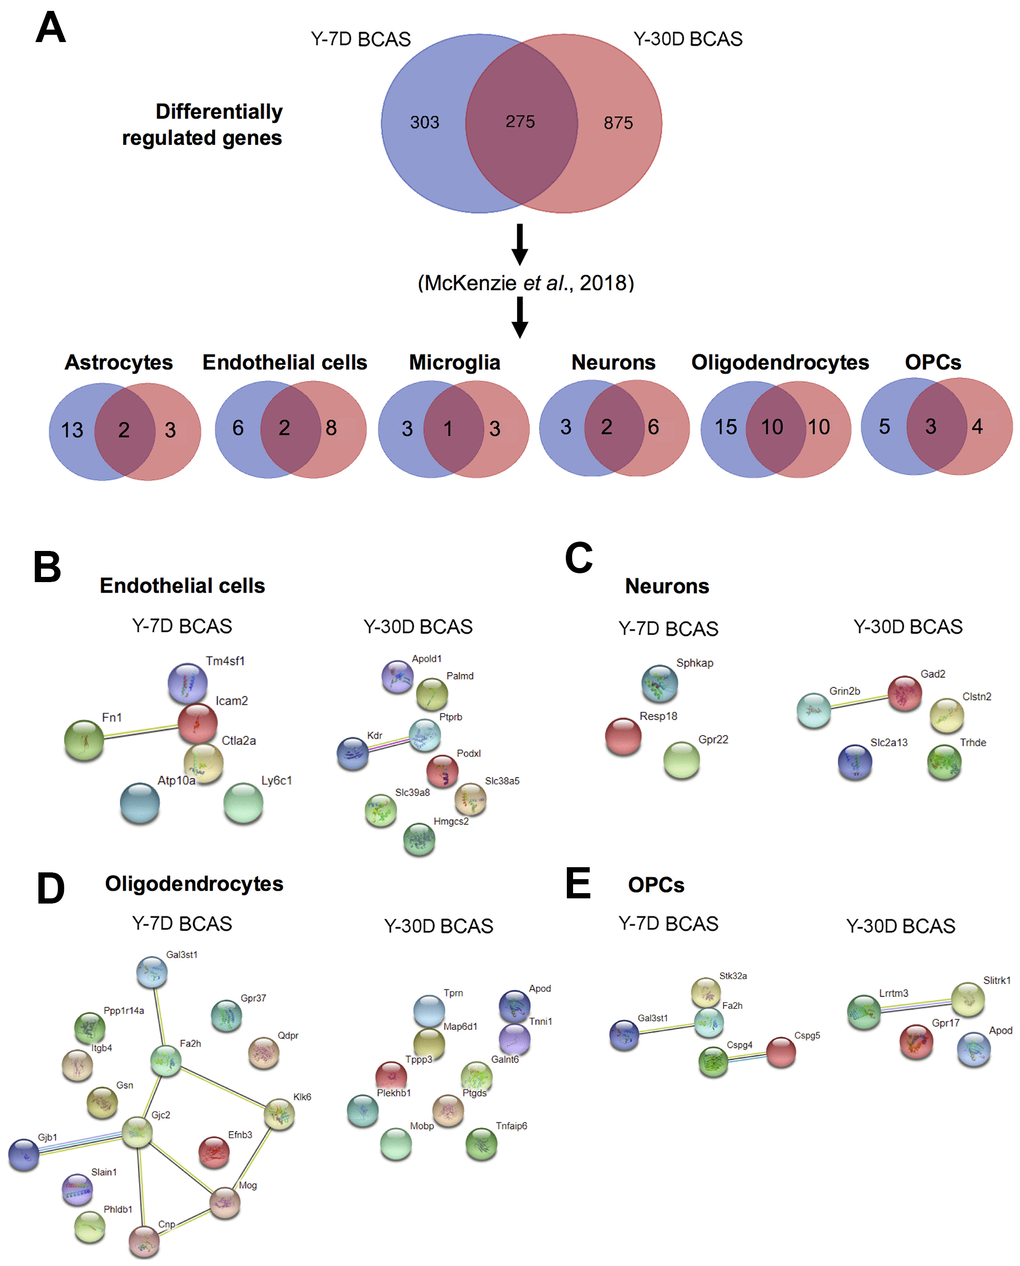
Figure 6.Analyses of differentially expressed mRNA transcripts in different brain cells following BCAS in young animals. (A) Venn diagram of statistically significant (adjusted p-value<0.05) differentially regulated genes in the Y7D/YSham vs Y30D/YSham comparison groups. The data was sorted according to cell type specificity based on a previously published database (Ref. 34) (Refer to Materials and Methods section for more details). The cell type specific profile of the genes are illustrated in six venn diagrams for each cell type including astrocytes, endothelial cells, microglia, neurons, oligodendrocytes and oligodendrocyte precursor cells (OPCs). The potential protein-protein interactions of cell type specific genes unique for the respective experimental groups of Y7D and Y30D respectively for endothelial cells (B), neurons (C), oligodendrocytes (D) and OPCs (E). The lines joining the different gene nodes indicate protein-protein associations such as known or predicted interactions and others such as text mining, co-expression or protein homology.