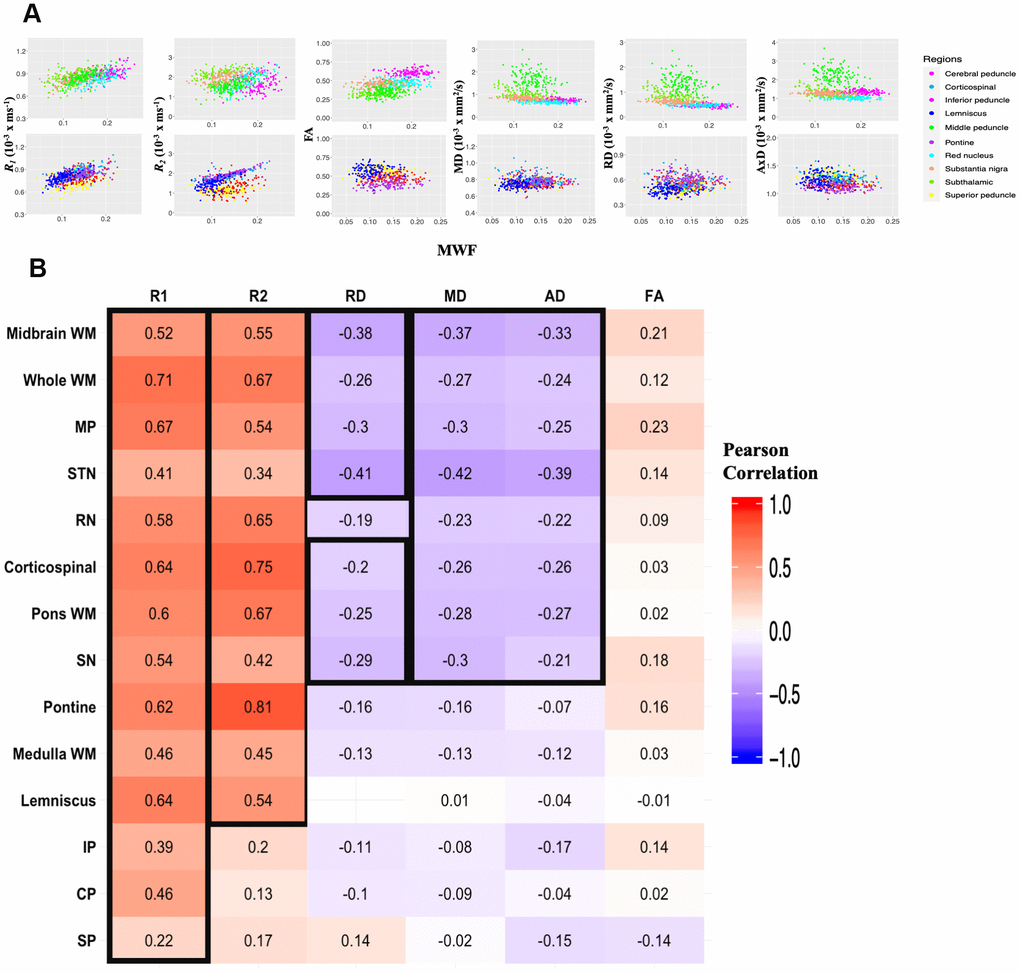
Figure 3.Regional correlations between MWF and relaxation rates or DTI indices. (A) Scatter plots illustrating the association between quantitative MRI measures and MWF across the 10 independent ROIs. Plots were split into 5 ROIs each for optimal visualization of the correlation trends between parameters. ROIs are indicated by different colors, matching those of Figure 5. Each participant is represented by a single dot. Pearson correlation analysis was conducted with results shown in Table 3. R1, R2 and FA exhibit a positive correlation with MWF while MD, RD, and AD are negatively correlated with MWF. (B) Correlational matrix providing the linear correlation coefficients values of each parameters against MWF for each ROI. Cell values in a black box represent Pearson correlation coefficients that were statistically significant after FDR (p < 0.05). The ROIs are ranked in order of decreasing mean R2 values across all metrics. Similarly, the parameters themselves are ranked in descending order of mean R2 values across all ROIs. MP, middle cerebellar peduncle; STN, subthalamic nucleus; RN, red nucleus; SN, substantia nigra; IP, inferior cerebellar peduncle; CP, cerebral peduncle; SP, superior cerebellar peduncle.
Figure 3 — Maturation and degeneration of the human brainstem across the adult lifespan | Aging