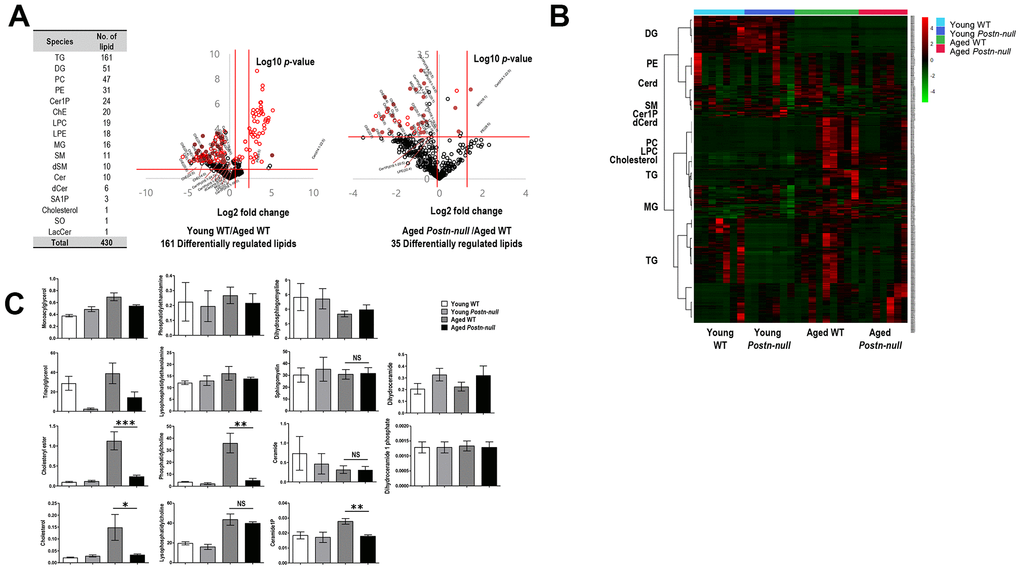
Figure 3.Overall lipid profiles according to kidney age and periostin expression. (A) Numbers of lipids identified. In total, 430 lipid species of 17 classes were identified. The volcano plot shows the magnitude and significance of the fold changes in young WT mice group (middle) and aged Postn-null mice (right) versus aged WT mice. The two vertical red lines indicate the |1.5|-fold change, and the horizontal line indicates a p-value of 0.05. Red dots are DRLs. (B) Clustering heatmap of the 430 lipids identified. (C) Lipid levels per class in the four study groups. Data are the mean ± SEM. Statistical significance was evaluated using Tukey tests. *p < 0.05; **p < 0.01; ***p < 0.001.