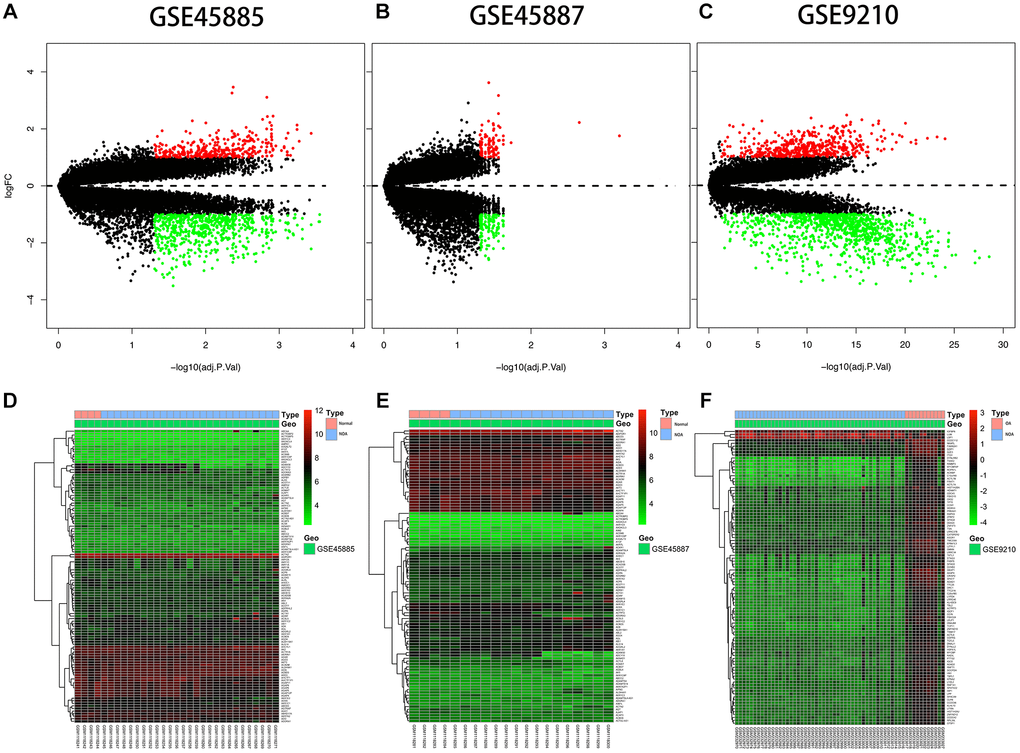
Figure 2.Differential expression analysis. (A, B, C) Volcano plot of DEGs. The y-axis is logFC and the x-axis represents -log10 (adjusted P-value). The red dots represent the DEGs upregulated and the green dots represent the DEGs downregulated while the black dots represent genes that were not differentially expressed. DEGs, differentially expressed genes; FC, fold change. (D, E, F) Heat map presenting the expression pattern across different samples. The horizontal axis represents sample names. The left vertical axis presented clusters of DEGs, and the top horizontal axis presents clusters of samples. Red represents upregulated genes and green represents downregulated genes.