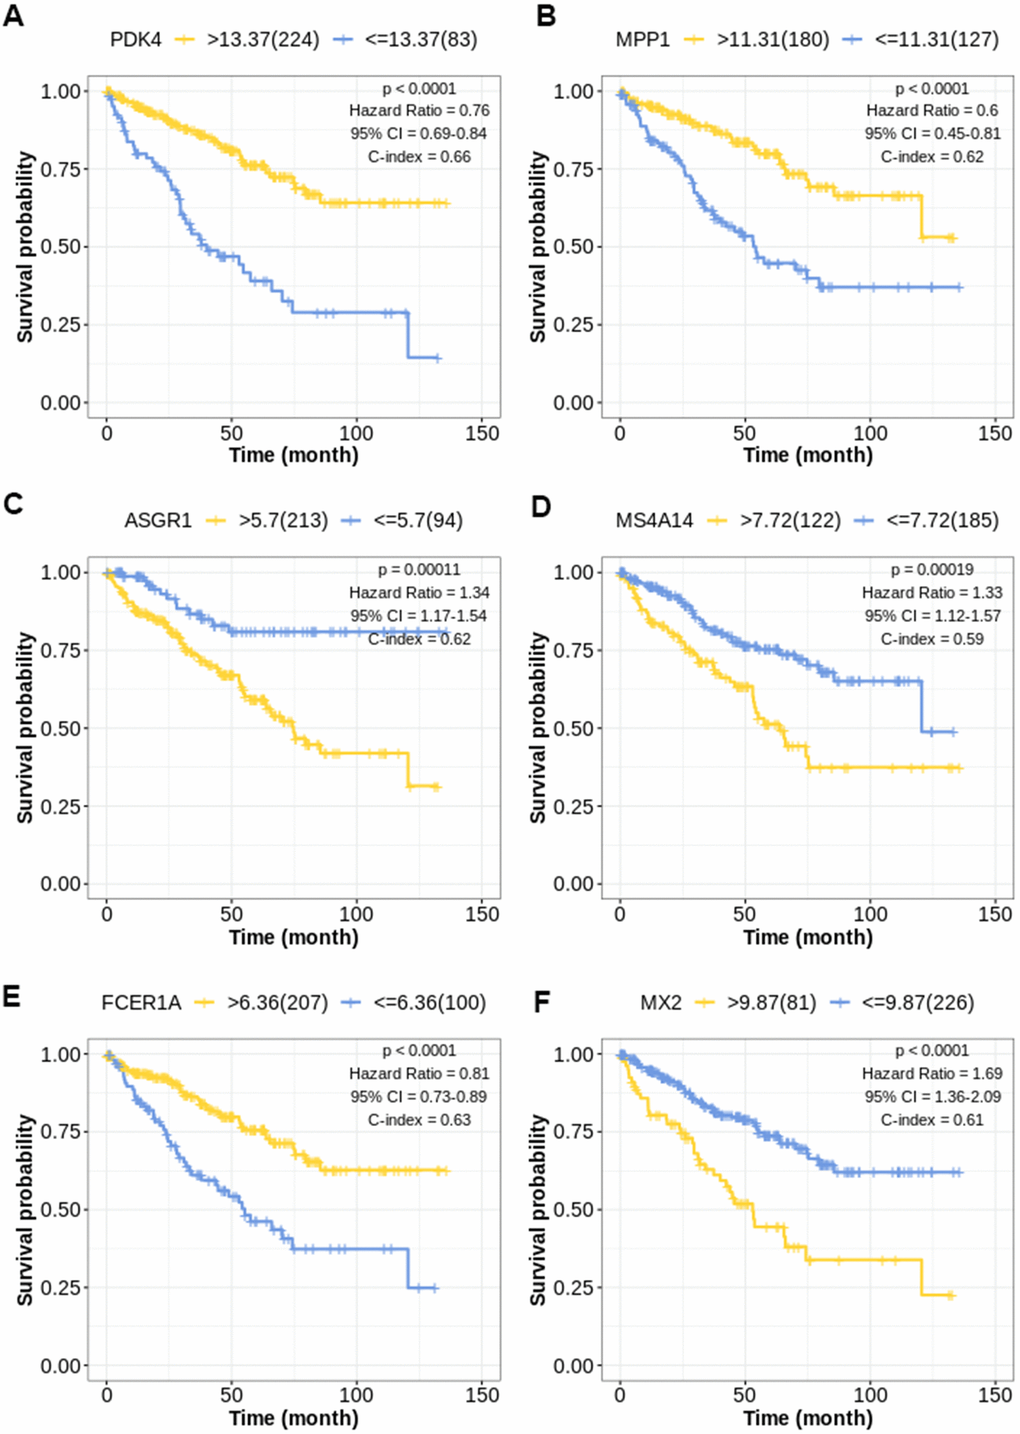
Figure 2.Kaplan-Meier survival curve for TIL-CD8T-related prognostic factors. The abscissa axis represents survival time; the ordinate axis represents survival probability. The survival curves of different colors represent different expression status of related genes. (A) Kaplan-Meier survival curve of PDK4 (P < 0.0001): Hazard Ratio=0.76, 95%CI [0.69, 0.84]; C-index= 0.66. (B) Kaplan-Meier survival curve of MPP1 (P < 0.0001): Hazard Ratio=0.60, 95%CI [0.45, 0.81]; C-index= 0.62. (C) Kaplan-Meier survival curve of ASGR1 (P = 0.00011): Hazard Ratio=1.34, 95%CI [1.17, 1.54]; C-index= 0.62. (D) Kaplan-Meier survival curve of MS4A14 (P = 0.00019): Hazard Ratio=1.33, 95%CI [1.12, 1.57]; C-index= 0.59. (E) Kaplan-Meier survival curve of FCER1A (P < 0.0001): Hazard Ratio=0.81, 95%CI [0.73, 0.89]; C-index= 0.63. (F) Kaplan-Meier survival curve of MX2 (P < 0.0001): Hazard Ratio=1.69, 95%CI [1.36, 2.09]; C-index= 0.61.