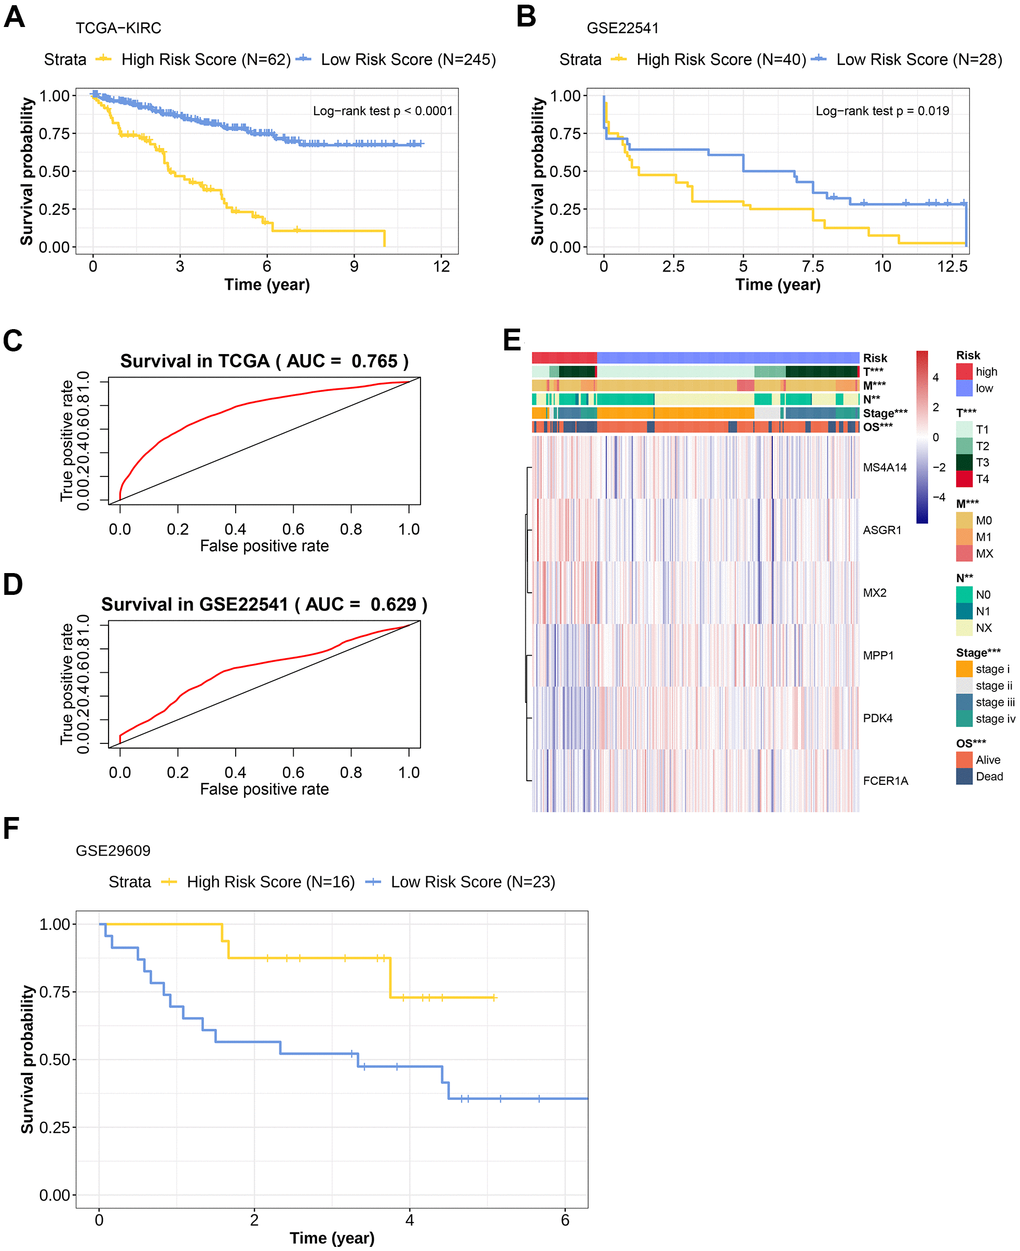
Figure 3.Prognostic efficacy evaluation of risk scoring model and external data verification. (A) Kaplan-Meier overall survival curve of patients in the TCGA-KIRC cohort. The abscissa axis represents survival time; the ordinate axis represents survival probability. The survival curves of different colors represent different risk score subgroups. (B) Kaplan-Meier overall survival curve of patients in the GSE22541 cohort. The abscissa axis represents survival time; the ordinate axis represents survival probability. The survival curves of different colors represent different risk score subgroups. (C) The predictive efficiency of the risk scoring model in the TCGA-KIRC cohort (AUC= 0.765). The abscissa axis represents false positive rate; the ordinate axis represents true positive rate. (D) The predictive efficiency of the risk scoring model in the GSE22541 cohort (AUC= 0.629). The abscissa axis represents false positive rate; the ordinate axis represents true positive rate. (E) Heatmap representation of the expression levels of genes included in the KIRC scoring model of the low and the high-risk groups, and the distribution of clinicopathological characteristics in the low and high-risk groups. (F) Kaplan-Meier overall survival curve of patients with KIRC in the GSE29609 cohort. The abscissa axis represents survival time; the ordinate axis represents survival probability. The survival curves of different colors represent different risk score subgroups.