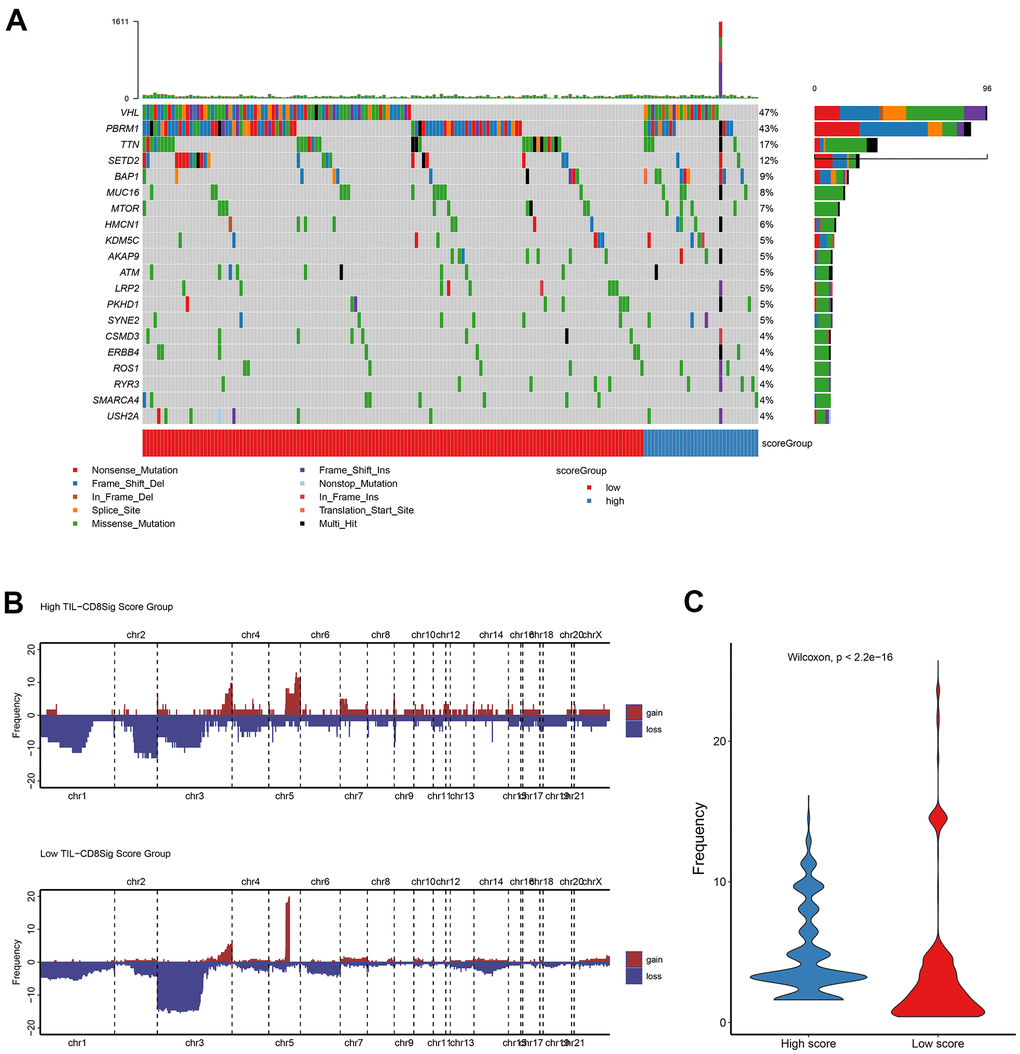
Figure 4.Genetic landscape analysis of mutation and copy number variation (CNV) in high and low TIL-CD8Sig score groups. (A) Mutation waterfall graph of different TIL-CD8Sig score subgroups in the TCGA-KIRC cohort. (B) CNV spectrum of different TIL-CD8Sig score subgroups in the TCGA-KIRC cohort. Different colors represent different CNV types (gain or loss); the abscissa axis represents chromosome locus; the ordinate axis represents CNV frequency. (C) The difference of mutation frequency in different TIL-CD8 Sig score subgroups. The abscissa axis represents different scoring groups; the ordinate axis represents mutation frequency.