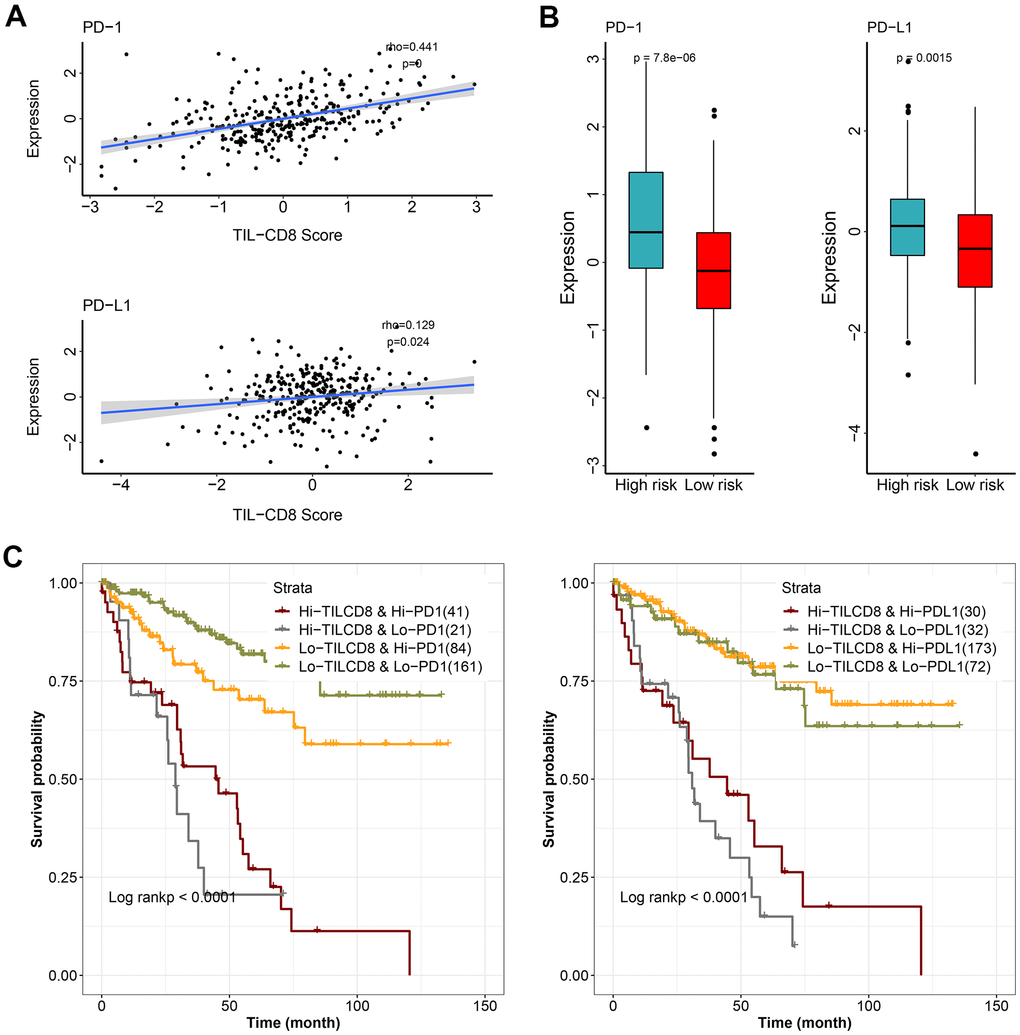
Figure 6.The effect of TIL-CD8Sig and immune checkpoint gene expression on patient survival. (A) The relationship between TIL-CD8Sig and the expression of immune checkpoint genes (PD-1 and PD-L1). The abscissa axis represents the TIL-CD8Sig Score, and the ordinate axis represents the expression level of PD-1/PD-L1. (B) Box plot of the expression distribution of immune checkpoint genes (PD-1 and PD-L1) in the high and low risk groups of TIL-CD8Sig. The abscissa axis represents different risk groups; the ordinate axis represents the expression level of PD-1/PD-L1. (C) Kaplan-Meier survival curve of OS in four groups of patients stratified by TIL-CD8Sig and immune checkpoint gene expression. The abscissa axis represents survival time; the ordinate axis represents survival probability.