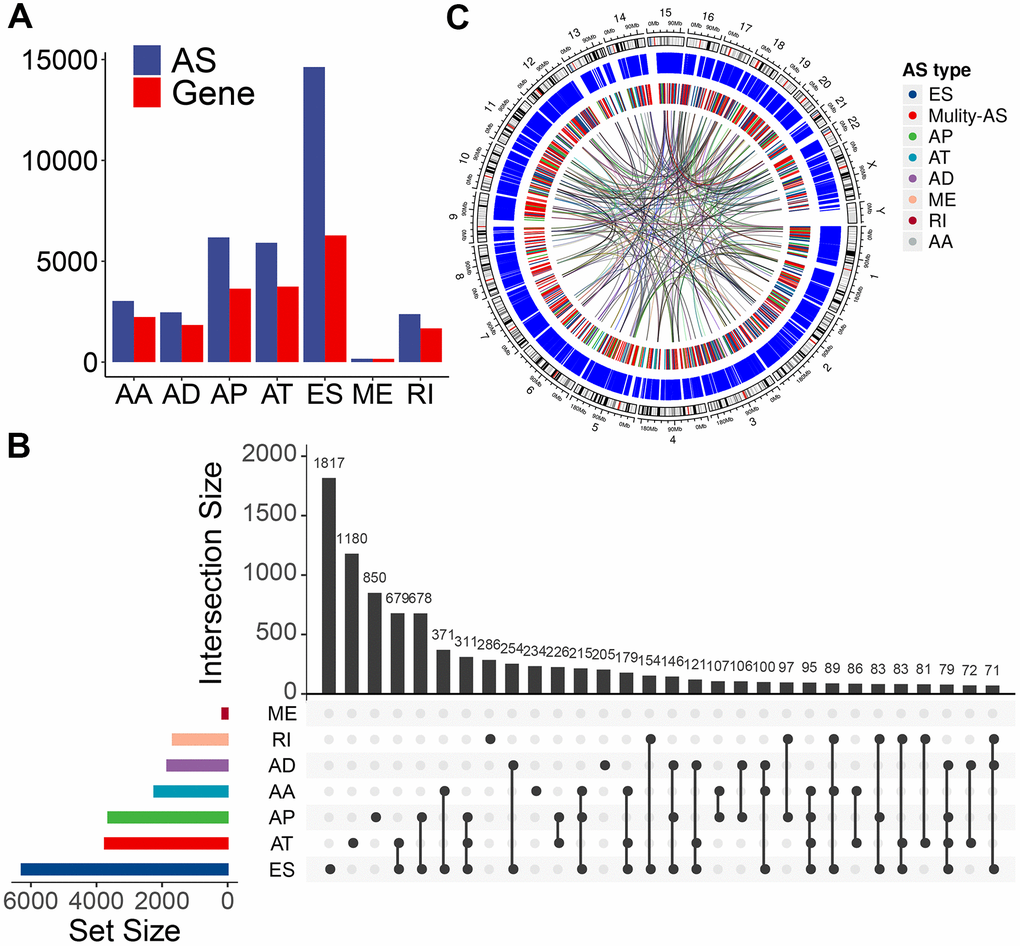
Figure 1.Overview of AS event profiling in the TCGA PTC cohort. (A) Number of each AS event type and their parent genes in PTC patients. Blue bars represent the AS events, while red bars represent their parent genes. (B) Interactive sets among seven types of AS events (n = 34,773) shown in an UpSet plot. (C) Circos plot shows the details of each AS event and their parent genes in the chromosome. The outer circle represents the chromosome ideogram. The intermediate circle represents the genes with filtered AS events. The inner circle shows the genes with differentially expressed AS events between tumor and normal tissues. The ribbons represent the potential interaction between AS events and their parent genes. ES, exon skipping; AP, alternate promoter; AT, alternate terminator; AD, alternate donor; AA, alternate acceptor site; ME, mutually exclusive exons; RI, retained intron. Mulity-AS, gene contains multiple types of AS.