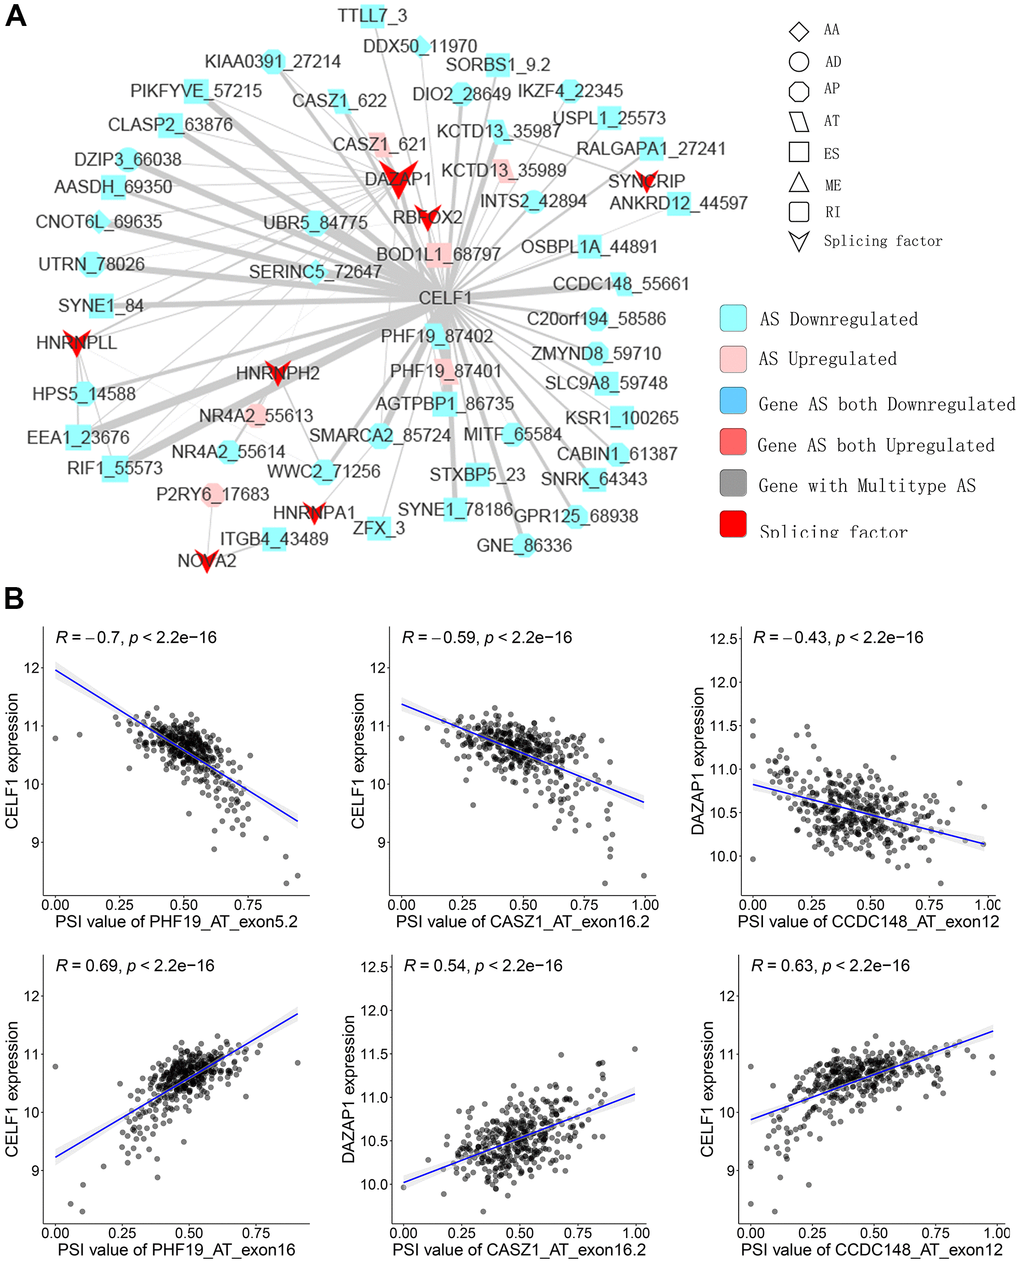
Figure 5.Representative plots of regulatory splicing network in PTC. (A) The correlation analysis between the expression levels of 71 SFs and the PSI values of CASEs. The shape, color, and size of node denote AS types, changes in the pattern (upregulated or downregulated), and the value of log2FC, respectively. The breadth of each line represents the extent of interaction strength. (B) Representative dot plots indicate the correlations between the expression of SFs and PSI values of CASEs.