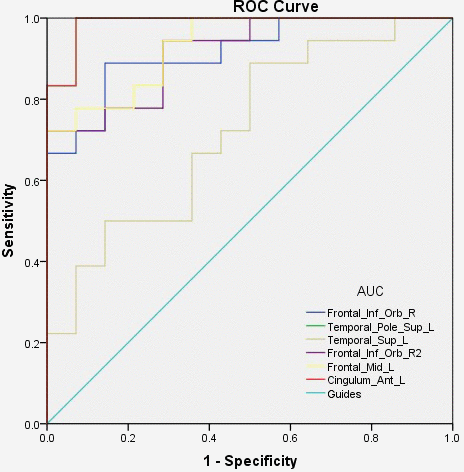
Figure 4.ROC curve analysis of the mean VBM values for altered brain regions. Notes: The area under the ROC curve were 0.917 (P<0.0001; 95% CI: 0.823-1.000) for Frontal_Inf_Orb_R, Temporal_Pole_Sup_L 0.988 (P<0.0001; 95% CI: 0.960-1.000), Temporal_Sup_L 0.722 (P=0.033; 95% CI: 0.544-0.900), Frontal_Inf_Orb_R2 0.917 (P<0.0001; 95% CI: 0.824-1.000), Frontal_Mid_L 0.933 (P<0.0001; 95% CI: 0.852-1.000), Cingulum_Ant_L 0.988 (P<0.0001; 95% CI: 0.960-1.000). Abbreviations: AUC, area under the curve; ROC, receiver operating characteristic.