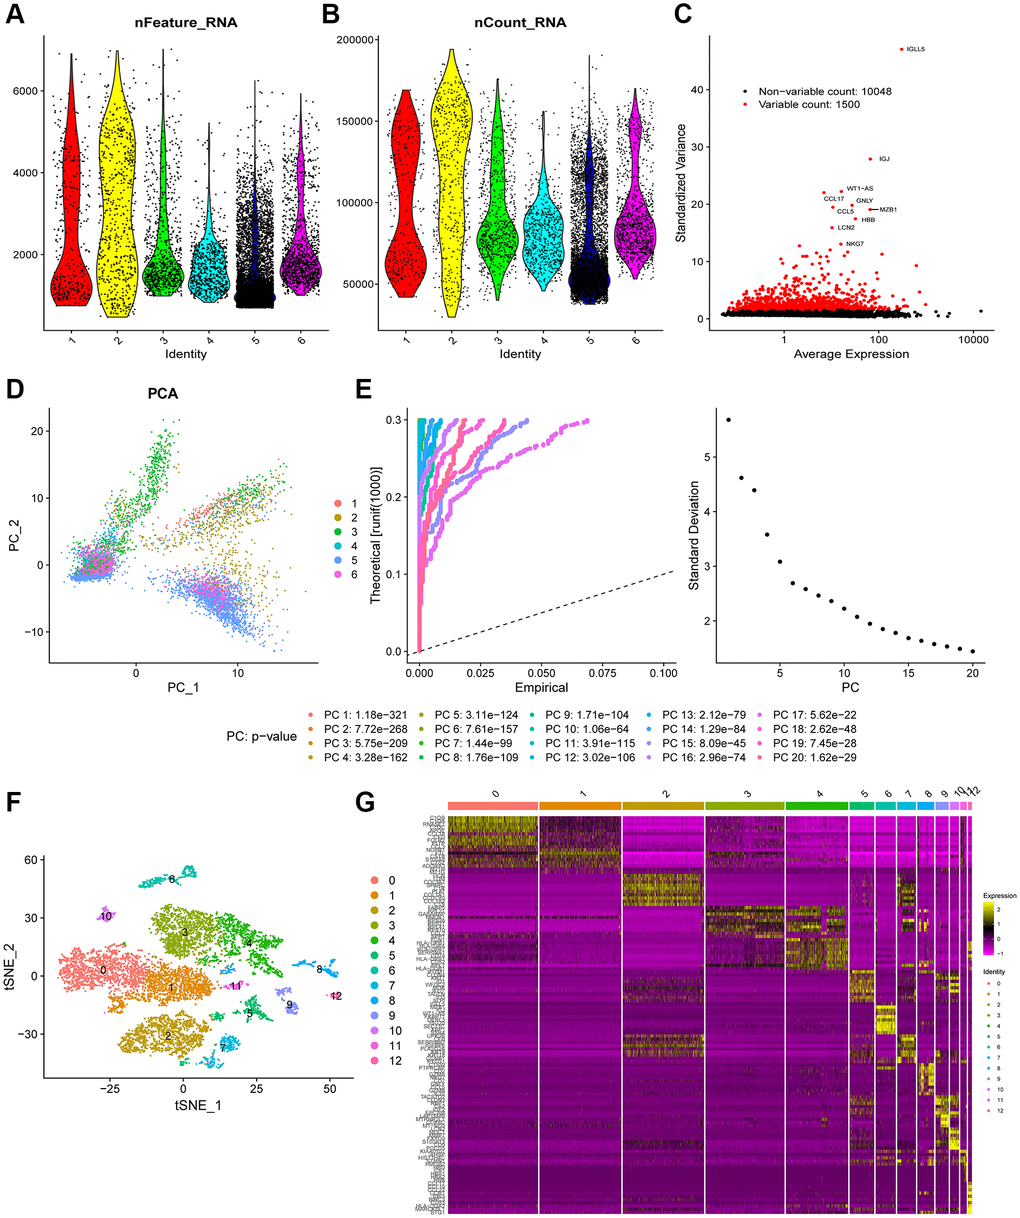
Figure 2.Heterogeneity in patients with ovarian cancer (OC) was identified using single-cell RNA-seq data. (A and B) A total of 9,609 cells from six OC patients were included in the analysis. (C) Scatter plots displayed 10,048 corresponding genes in all cells from OC samples. (D) The principal component analysis (PCA) revealed unclear separations of OC cells. (E) The first 20 principal components with a p-value < 0.05 were generated by PCA. (F) OC cells were categorized into 13 clusters using the tSNE algorithm with the first 20 principal components. (G) The heatmap shows the top 10 differential marker genes of each cluster. A total of 124 unique genes were identified after removing the same marker genes among the clusters.