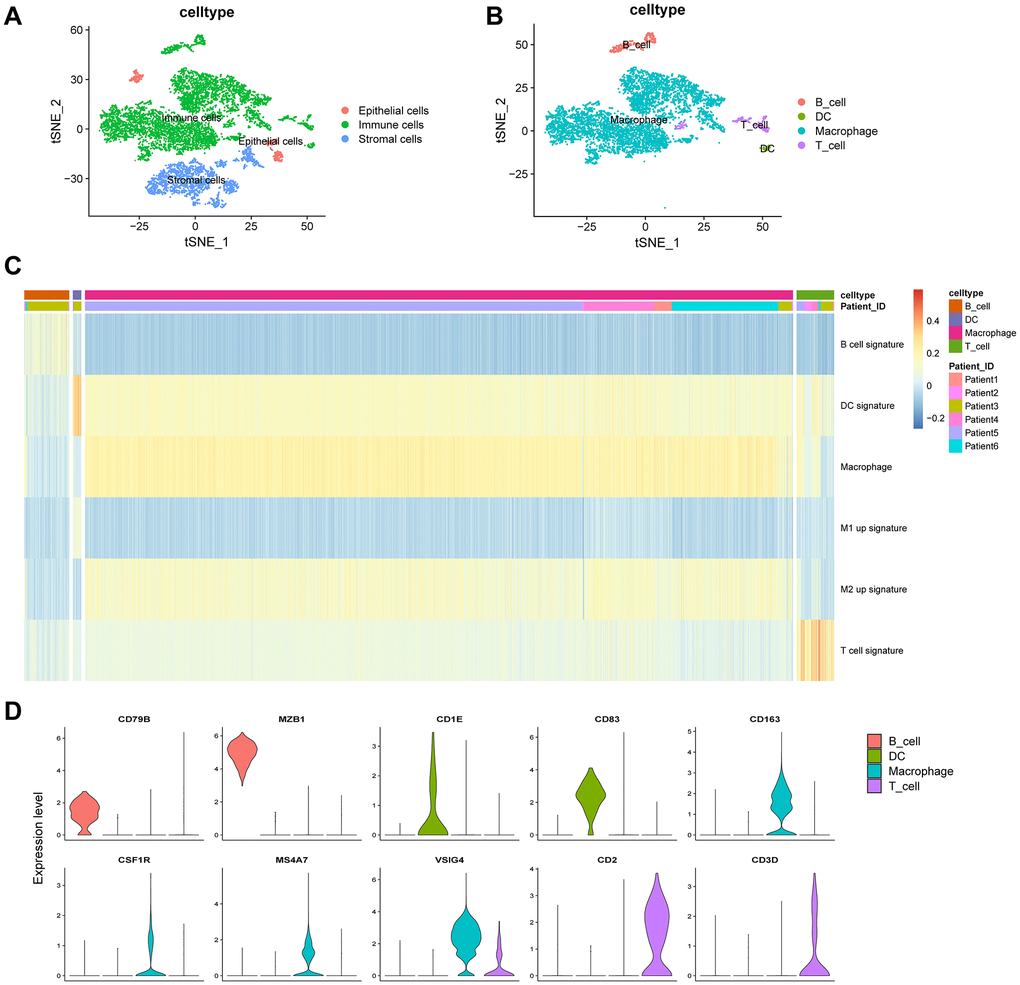
Figure 3.Clustering of immune cell populations and GSVA enrichment scores. (A) Cell-types visualized using tSNE dimensionality reduction revealed the clustering of tumor-stroma immune cells. (B) Immune cells in the tumor microenvironment were annotated into four subpopulations. (C) Hierarchical clustering was used using GSVA enrichment scores for gene set for B cell signature, DC signature, macrophage signature, M1 up signature, M2 up signature, and T cell signature. (D) Violin plot indicates the genes corresponding to immune cell subpopulations.