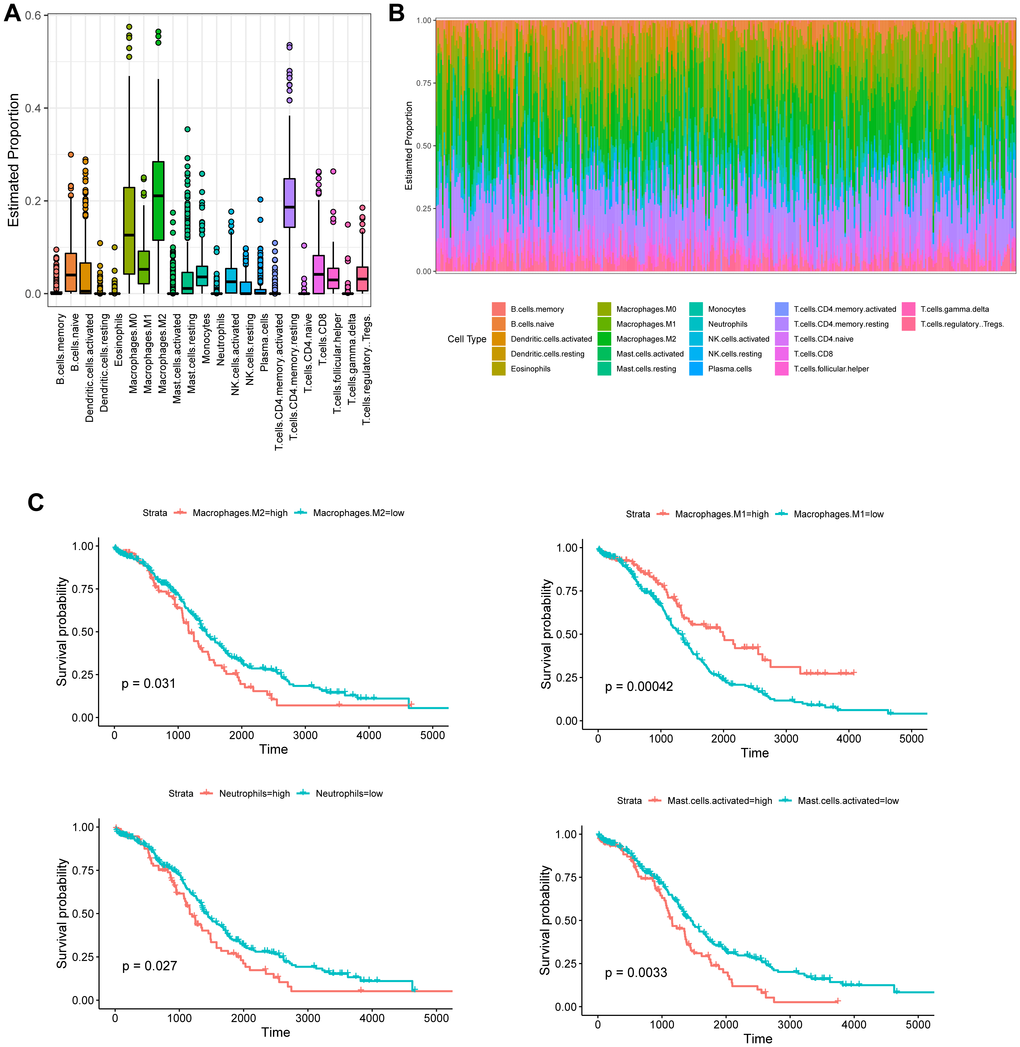
Figure 4.Tumor-infiltrating immune cell profile of OC samples and survival analysis. (A) Boxplot and barplot (B) display the proportion of 22 infiltrating immune cell types in OC samples. (C) Kaplan–Meier analysis of overall survival with respect to M2 macrophages, M1 macrophages, activated mast cells, and neutrophils in TCGA-OC.