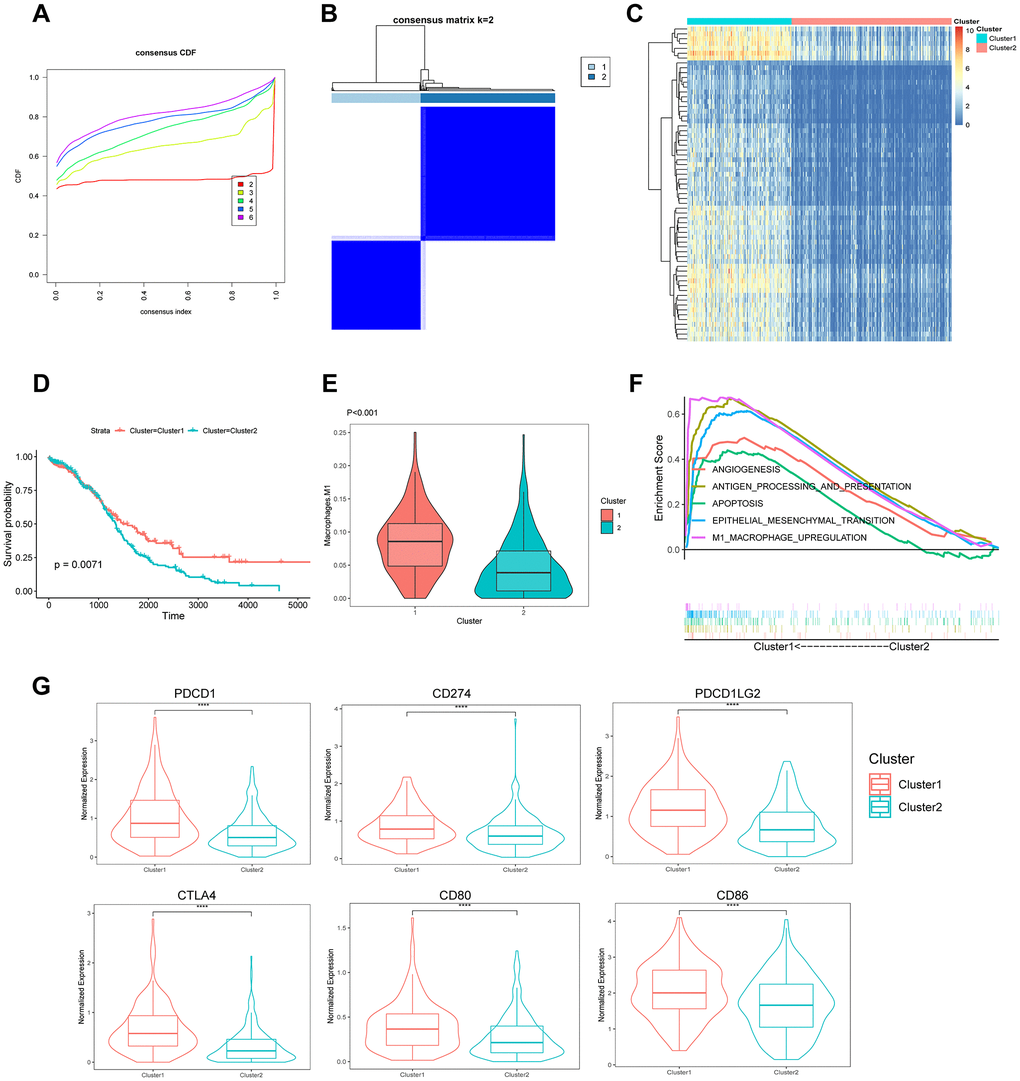
Figure 6.Identification of the molecular subtypes based on 219 TAMRG signatures. (A) CDF plot of the consensus score (k = 2–6). (B) Consensus clustering matrix for k = 2. (C) Heatmap showing differentially expressed genes between the two groups. (D) Kaplan–Meier analysis of overall survival for clusters 1 and 2. (E) The TAM abundance of two groups is shown in violin plots. (F) Upregulated pathways in GSEA. (G) The expression of six immune checkpoints between the two molecular subtypes.