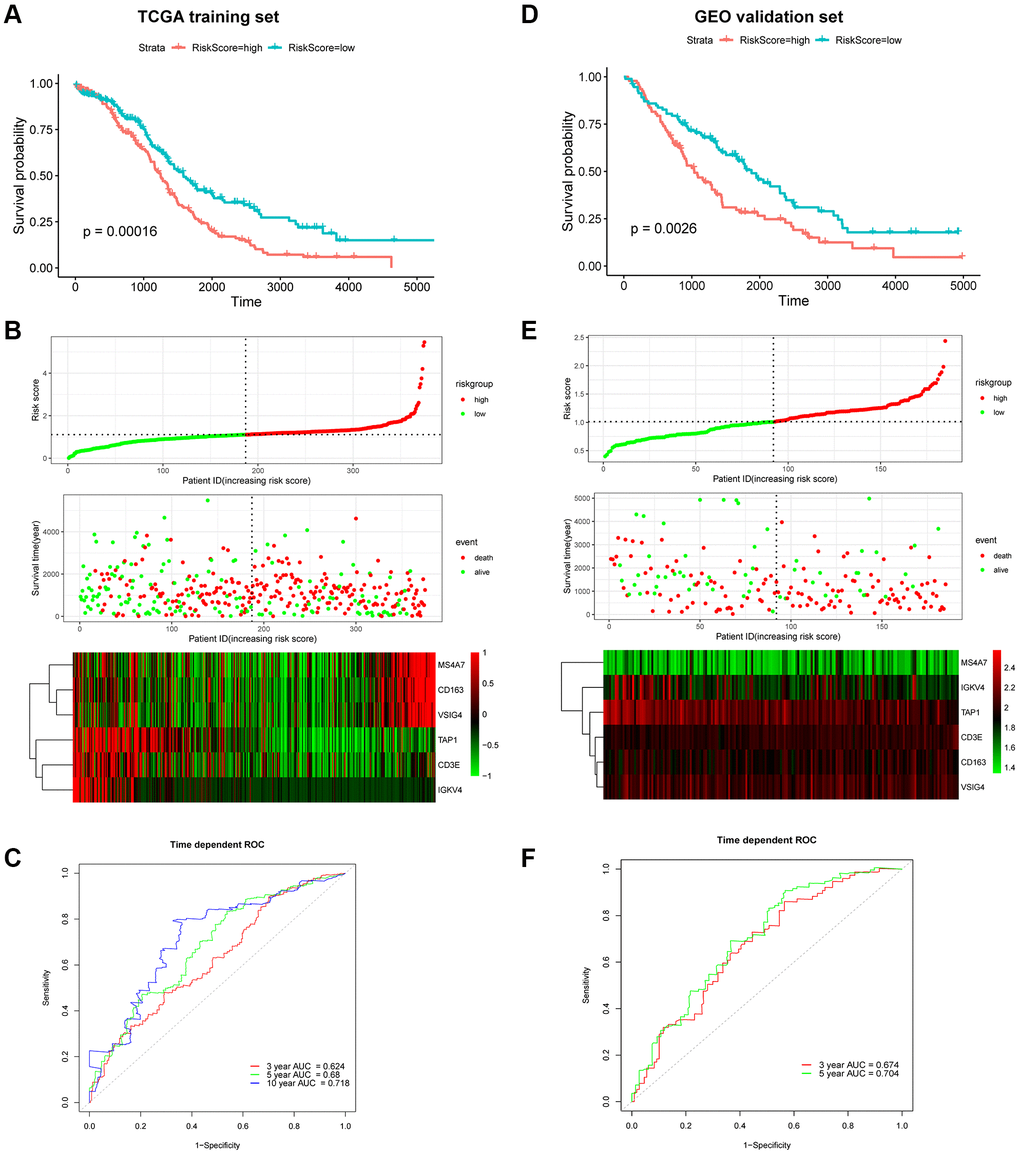
Figure 7.Prognostic analysis of the 6-gene signature in OC patients. Kaplan–Meier OS curve of low-risk and high-risk groups in the TCGA training dataset (A) and GEO validation dataset (D). Risk score distribution in TCGA (B) and GEO (E) datasets. Upper panel: The curve of risk score. Middle panel: patients’ overall survival status and time. Bottom panel: Heatmaps of gene expression profiles. ROC curve for OS prediction in the TCGA (C) and GEO (F) datasets.