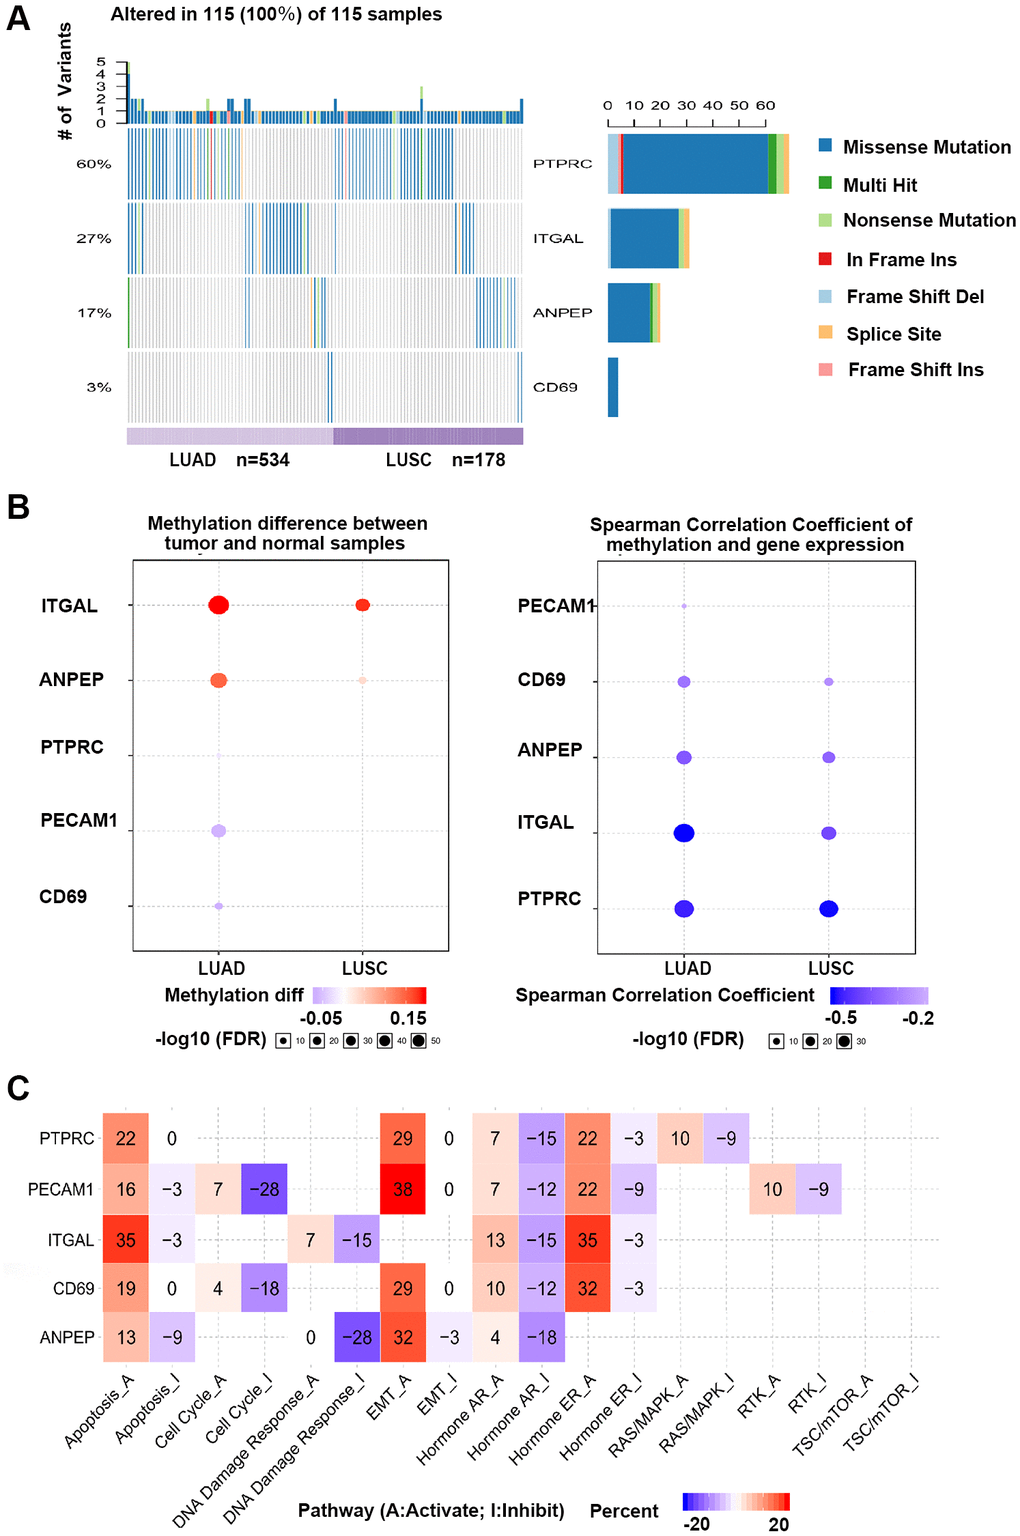
Figure 7.GSCA online database was selected to analyze the single nucleotide variation, methylation and pathway activity of validated genes. (A) Waterfall plots, gives a single nucleotide variation of in LUAD and LUSC gene sets. (B) Methylation of hub genes, Blue points represented a methylation upregulation in tumors, red points represented a methylation downregulation in tumors, the deeper of color, the higher the difference. Student T test were performed to define the methylation difference between tumor and normal samples. The association between mRNA expression and methylation was based on Person’s product moment correlation coefficient, and followed a t distribution. Blue points represented negative correlation, and red represented positive correlation, the deeper of color, the higher the correlation. P value was adjusted by false discovery rate (FDR), FDR ≤ 0.05 was considered as significant. Size of the point represents statistic significance (C) Effects of validated gene on cell pathway activity, gene expression was divided into 2 groups (High and Low) by median expression, the difference of pathway activity score (PAS) between groups was defined by student T test, P value was adjusted by FDR, FDR ≤ 0.05 was considered as significant. Pathway Activity module presents the correlation of genes expression with pathway activity groups (activation and inhibition) that defined by pathway scores.