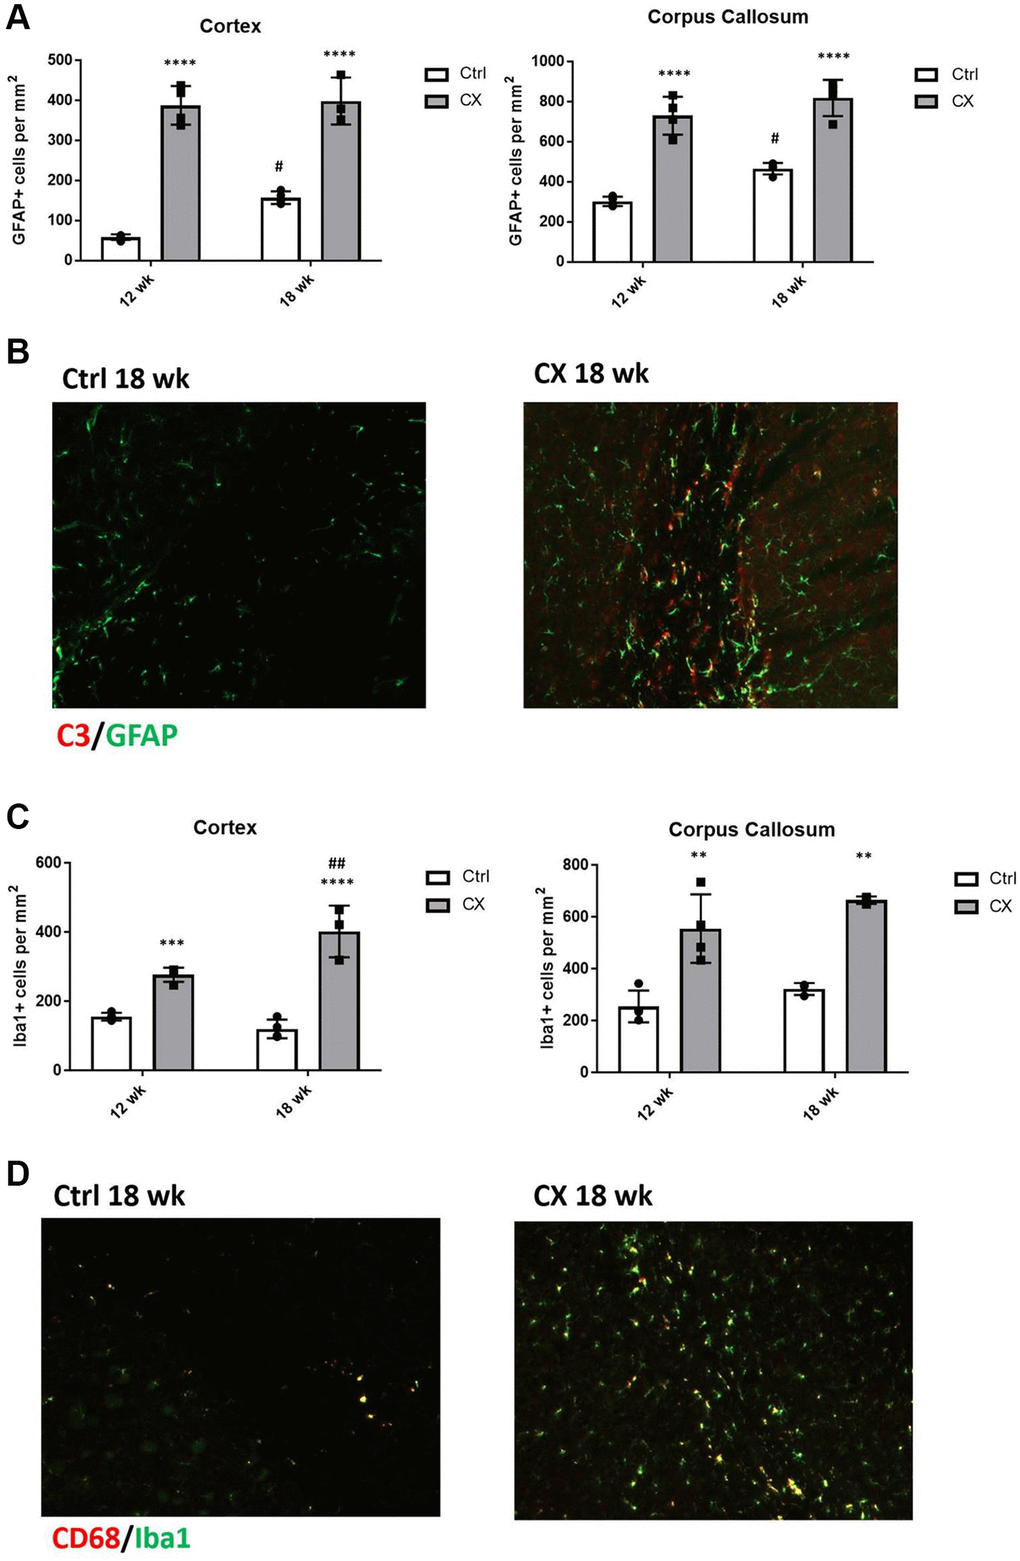
Figure 5.CX mice display astrocyte and microglia activation in the brain. (A) Reactive astrocytes number increase in CX brain cortex and corpus callosum, as measured by GFAP staining. (B) C3, a marker of active astrocytes co-stains with GFAP in CX mice. (C) Microglia number in CX brain cortex and corpus callosum, shown by Iba1 positive cells. (D) CD68, a marker or active microglia co-stains with Iba1 in CX mice brain, n = 4 for all experiments. Data are presented as mean ± SE. Two way Anova followed by Tukey’s post hoc test, n = 4. P values of less than or equal to 0.05, 0.01, 0.001 and 0.0001 are indicated by asterisks (*) when comparing within the same age group and by the pound sign (#) when comparing between age groups. Abbreviations: Ctrl: control; Wk: weeks.