Submit an Article
Navigate
Home
Editorial Board
Editorial Policies
Current Volume
Archive
Scientific Integrity
Publication Ethics Statements
Interviews with Outstanding Authors
Newsroom
Sponsored Conferences
Podcast
Contact
Special Collections
Submit an Article
Online ISSN: 1945-4589
Research Paper
|
Volume 13, Issue 19
|
pp. 23284–23307
Transcriptome research identifies four hub genes related to primary myelofibrosis: a holistic research by weighted gene co-expression network analysis
Back to article
Figure 1
(1 of 11)
−
100%
+
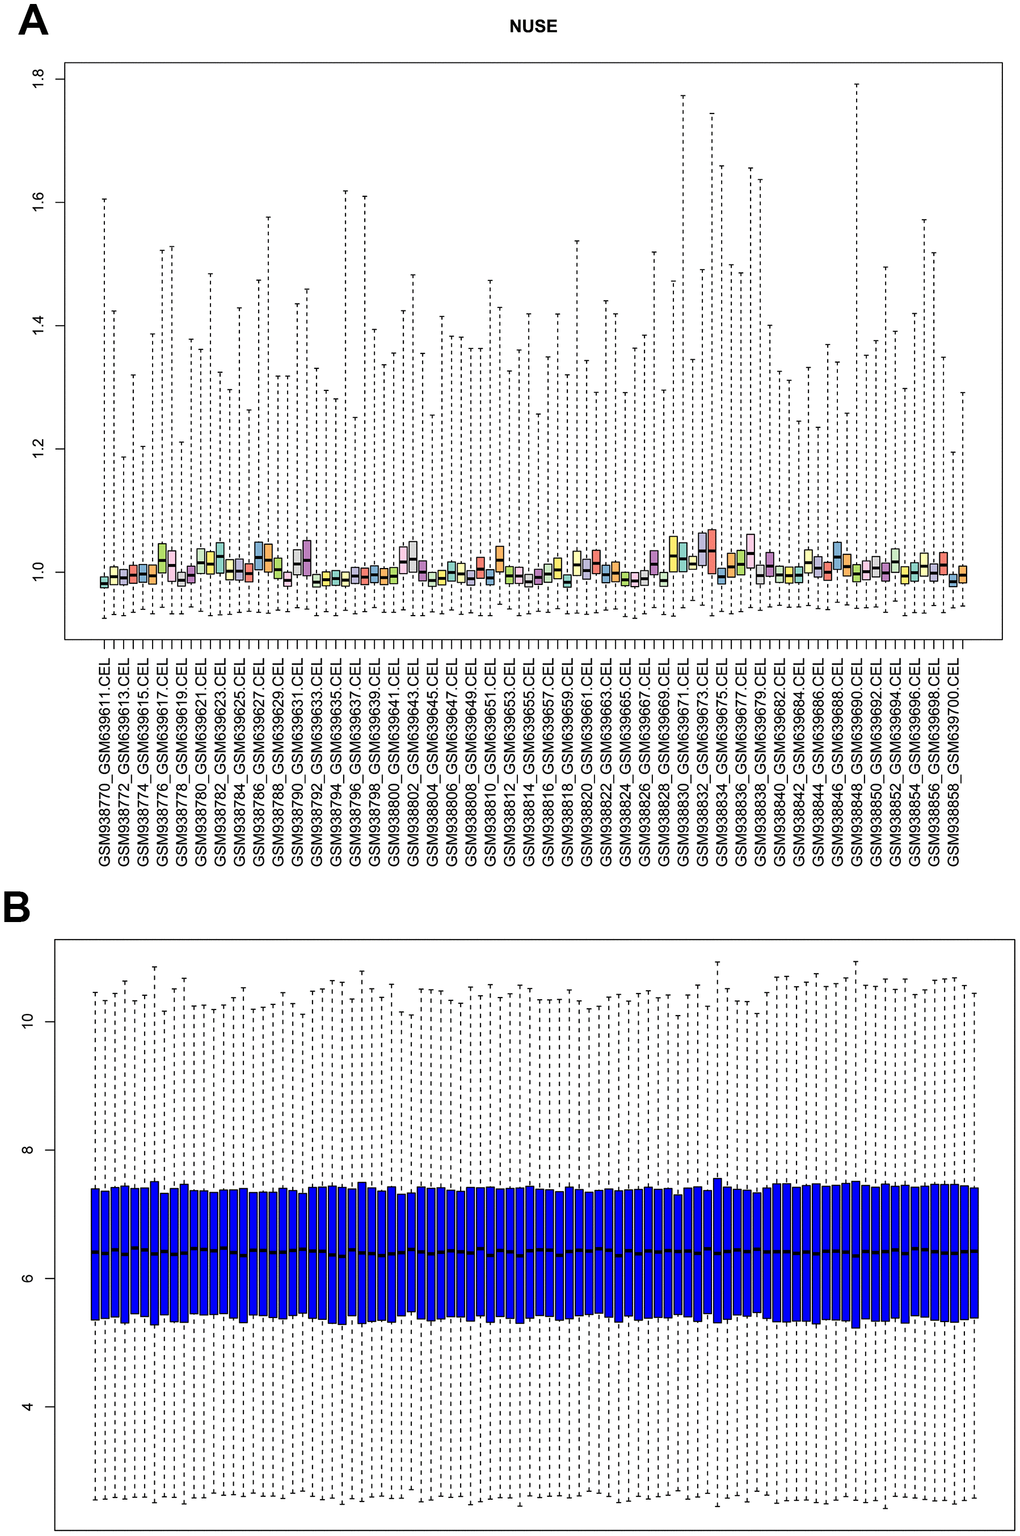
Figure 1.
(
A
) Normalized unscaled standard error (NUSE) plot of GSE26049 for quality control. (
B
) box plot of gene expression level in GSE26049 after RMA background correction and normalization.