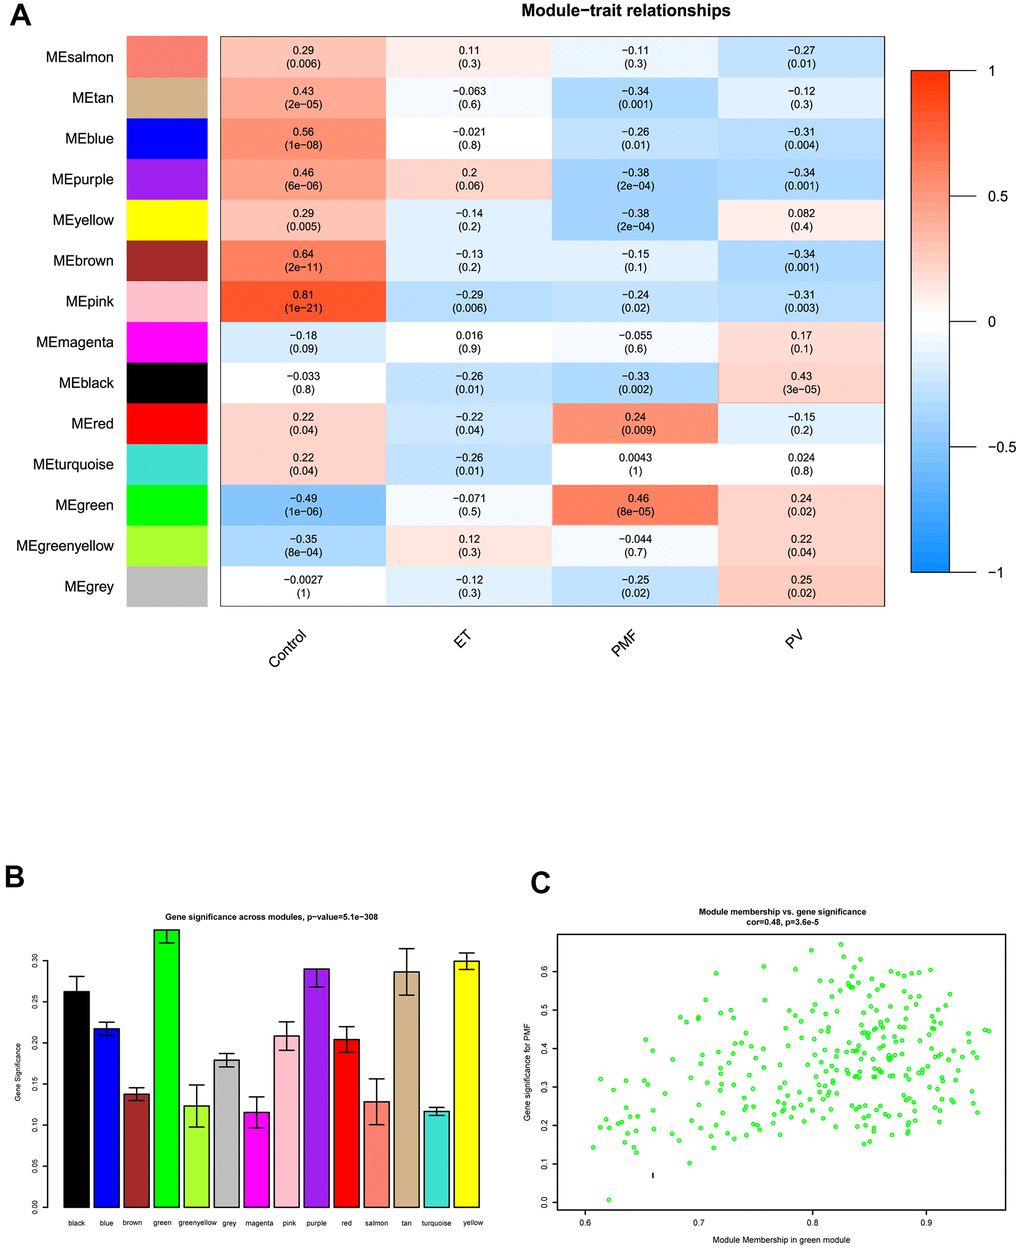
Figure 4.(A) The module-trait relationship heatmap between MEs and features. Each row corresponded to a module eigengene and column to a feature. The first column was normal samples; the second column was essential thrombocythemia; the third column was primary myelofibrosis; and the fourth column was polycythemia vera. Each square contained corresponding correlation (first line) and p value (second line). The left side of heat map indicated the module name, right side of heat map indicated the colors of correlation (blue represented negatively correlated, red represented positively correlated). (B) Histogram of gene significance across modules in PMF group. (C) The correlation between gene significance and module membership in green module. The y-axis indicated gene significance in green module, and x-axis represented the module membership in green module.