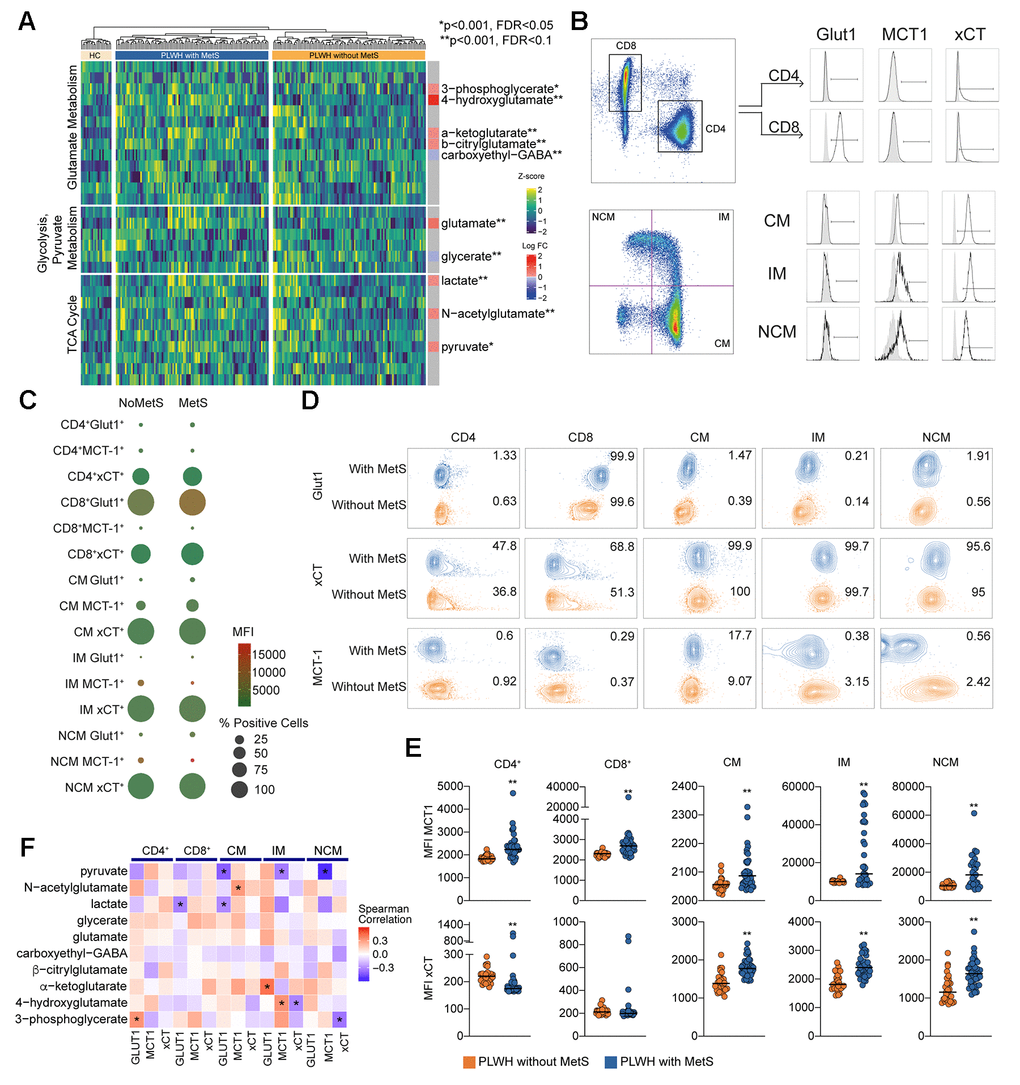
Figure 3.Central carbon metabolism with higher efflux of key metabolites. (A) Heatmap showing the level of metabolites of glutamate metabolism, glycolysis/gluconeogenesis/pyruvate metabolism, and TCA cycle. The statistically significant differentially abundant metabolites are marked with single asterisk at the level of p < 0.001 and FDR < 0.1 and double asterisk p < 0.001 and FDR < 0.05 using LIMMA. Single asterisks indicate statistically significant differences p < 0.001 and FDR < 0.1 and double asterisk p < 0.001 and FDR < 0.05. (B) Gating strategy for Glut1, MCT-1, and xCT in T cells (CD4 and CD8) and monocytes (CM, IM, and NCM). (C) Bubble plot of Glut1, MCT-1, and xCT in subpopulations. Size of the bubble represents proportion of positive cells (%). Color of the bubbles represent MFI. (D) Contour plots showing sample with median percentage of cells for each population. (E) MFI for MCT-1 and xCT in lymphocytes (CD4 and CD8) and monocytes (CM, IM, and NCM). (F) Co-relation analysis between the transporter expression and the differentially altered metabolites between PLWH with MetS and without MetS as shown in Figure 3A. Asterisk indicates p < 0.05.