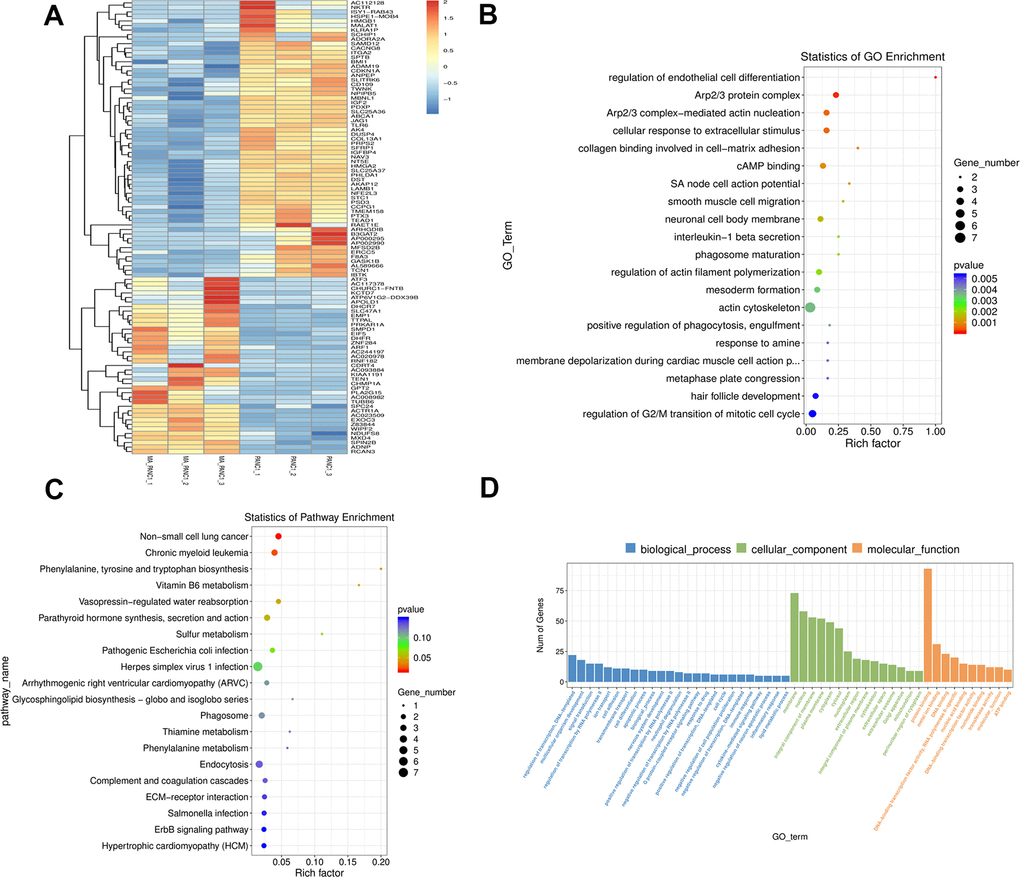
Figure 6.GO and KEGG pathway enrichment analysis of DEGs between PANC-1 and MA treated PANC-1. (A) The cluster heat map of the first 100 DEGs in the PANC-1 and MA PANC-1 datasets. The abscissa indicates the number of samples, whereas the ordinate indicates DEGs. The histogram in the upper right corner represents the color level; each rectangle corresponds to the expression value of a sample. (B, C) GO enrichment analysis and KEGG pathway enrichment analysis of DEGs in PANC-1 cells post MA treatment. The results showed the GO Term and pathway of the top 20 enriched significantly in the form of a scatter plot. (D) GO term of Top 25, Top15, Top 10. According to the number of differential genes annotated to GO Term, they are arranged in descending order, showing the distribution of the number of significantly different genes in GO Term enriched in biological processes, cell components, and molecular functions.