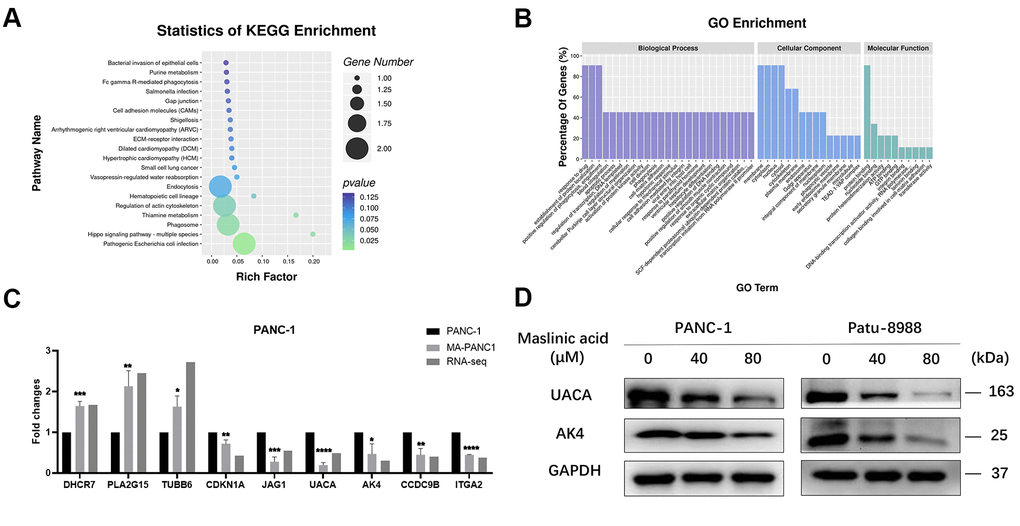
Figure 8.Association analysis of differential genes and differential proteins. (A) The top 20 enriched pathways for DEGs. (B) Top 25, top15, and top10 GO Terms according to the number of different genes annotated to GO terms in descending order. (C) QRT-PCR analysis of DEGs in PANC-1 and MA-treated PANC-1 cells. (D) Western blot analysis of the expression of UACA and AK4 in MA-treated PANC-1 and Patu-8988 cells. Data are presented as fold change and as mean ± SD of three independent experiments. ***p < 0.001, ****p <0.0001.