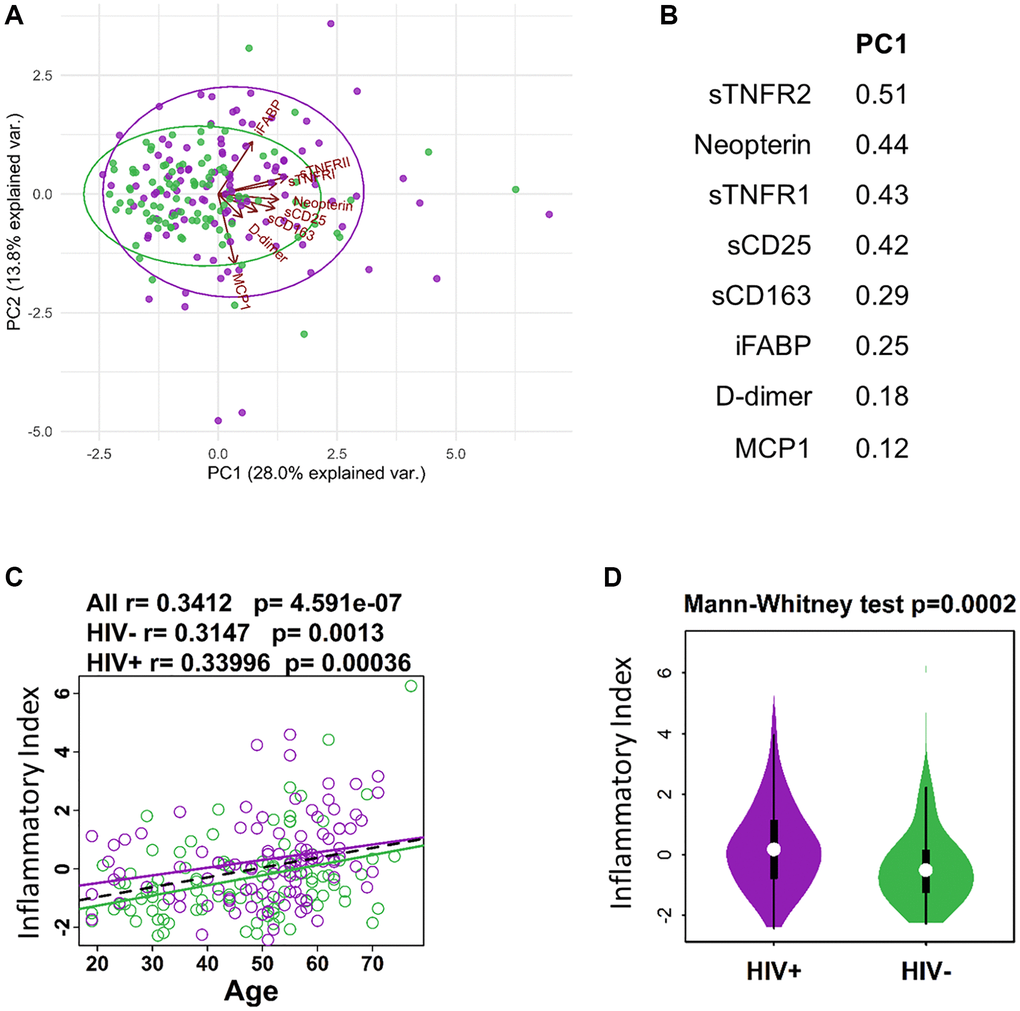
Figure 1.Defining inflammatory index for aging and HIV infection. (A) PCA plot showing distribution of HIV- (green) and HIV+ (purple) individuals in relation to protein expression from inflammatory index and Age in years. (B) List of proteins (standardized variables) in the inflammatory index and their weights extracted from PC1 in A. (C) Regression of Age with inflammatory index (sum of standardized variables from B multiplied by their weights extracted from PC1). (D) Violin plot showing the difference in inflammatory index between HIV- and HIV+ participants.