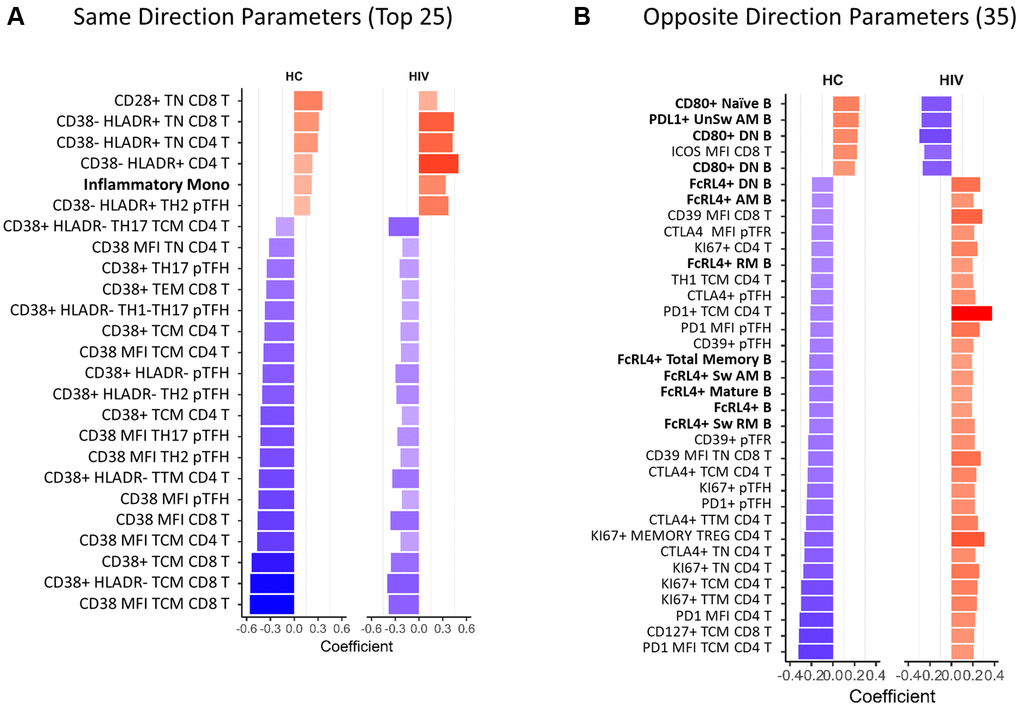
Figure 3.Overlapping age-associated parameters in HIV-negative and HIV-positive groups. Bar graphs showing correlation coefficients for the top parameters with same direction (A) and opposite direction (B) significant correlations with age in HIV-negative and HIV-positive participants. Only the top 25 out of 78 same direction parameters are displayed in (A), the rest are listed in Supplementary Table 3. All opposite direction parameters are shown in (B). In red font are non-T cell parameters. Bold font indicates CD38 and HLADR containing parameters. HC = HIV negative, healthy control. Spearman test was performed for each parameter and chronological age, p < 0.05 was considered significant. In bar graphs, red denotes a positive correlation and blue denotes a negative correlation.