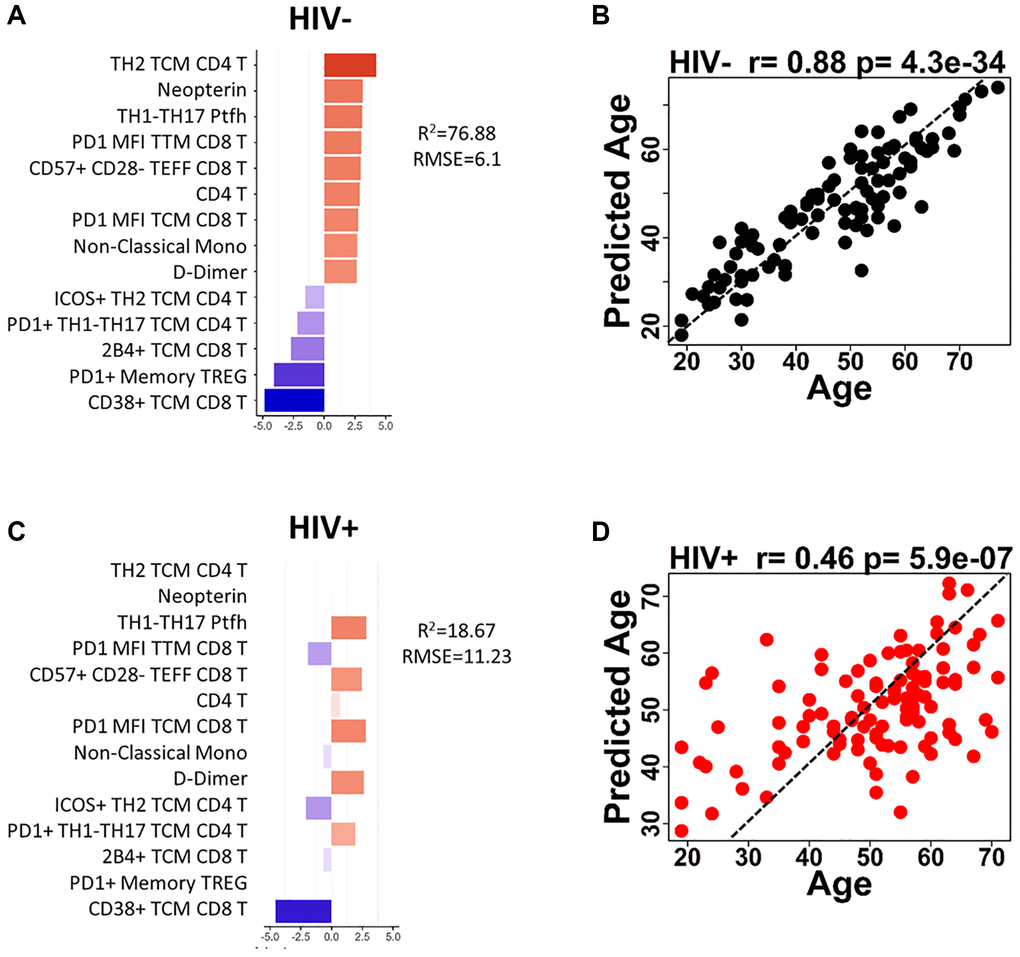
Figure 4.Age prediction modeling using HIV-negative as reference population and age-associated parameters. (A) Bar graph shows each of the 14 parameters included in the HIV-negative, trained model and indicates the coefficient for each parameter when applied to HIV negative participants. (B) The correlation between predicted age and actual age using the 14-parameter model is shown for HIV-negative participants. (C) Bar graph shows each of the 14 parameters included in the HIV-negative, trained model and indicates the coefficient for each parameter when applied to HIV positive participants. (D) The correlation between predicted age and actual age using the 14-parameter model is shown for HIV-positive participants. Correlations were determined using Spearman test. Red bars denote a positive association with predicted age and blue bars denote a negative association. Dotted lines in (B and D) show theoretical relationship for a perfect positive correlation for visualization purposes.