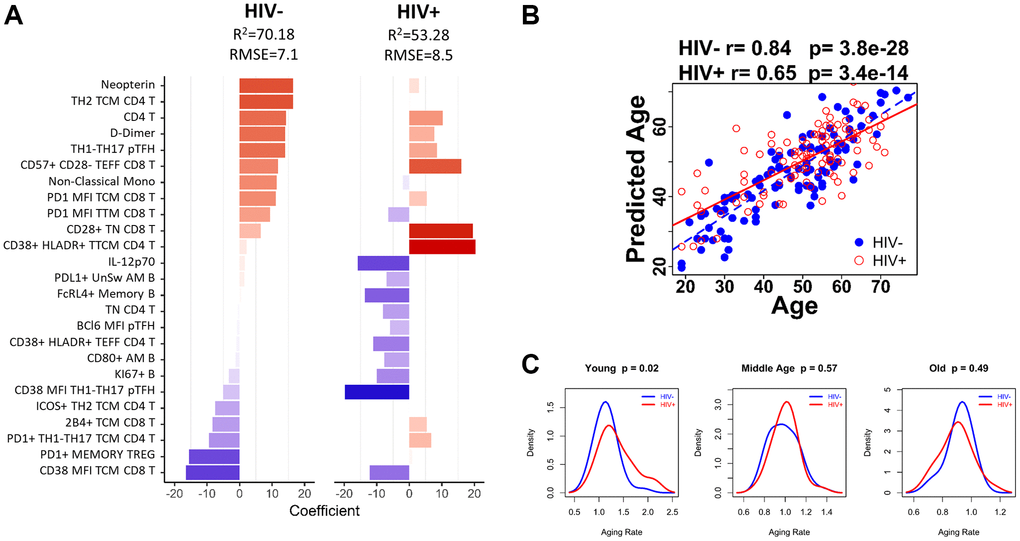
Figure 5.Age-associated immune parameters reveal accelerated aging in young HIV-infected group. (A) 25-parameter model to predict age in HC and HIV. Bar graph shows each of the parameters included in the model and indicates the coefficient for each parameter when applied to HIV negative (HC) participants and HIV-positive participants. Red bars denote a positive association with predicted age and blue bars denote a negative association. (B) The correlation between predicted age and actual age using the 25-parameter model is shown for HIV-negative (blue dots) and HIV-positive participants (red circles) using Spearman correlation test. (C) Density curves comparing the aging rate in HIV-negative (blue line) and HIV-positive (red line) participants in 3 age groups: Young (<40 yrs), Middle Age (41–59 yrs), and Old (>60 yrs). Student’s t test was performed to determine difference in aging rate, significance was considered when p < 0.05.