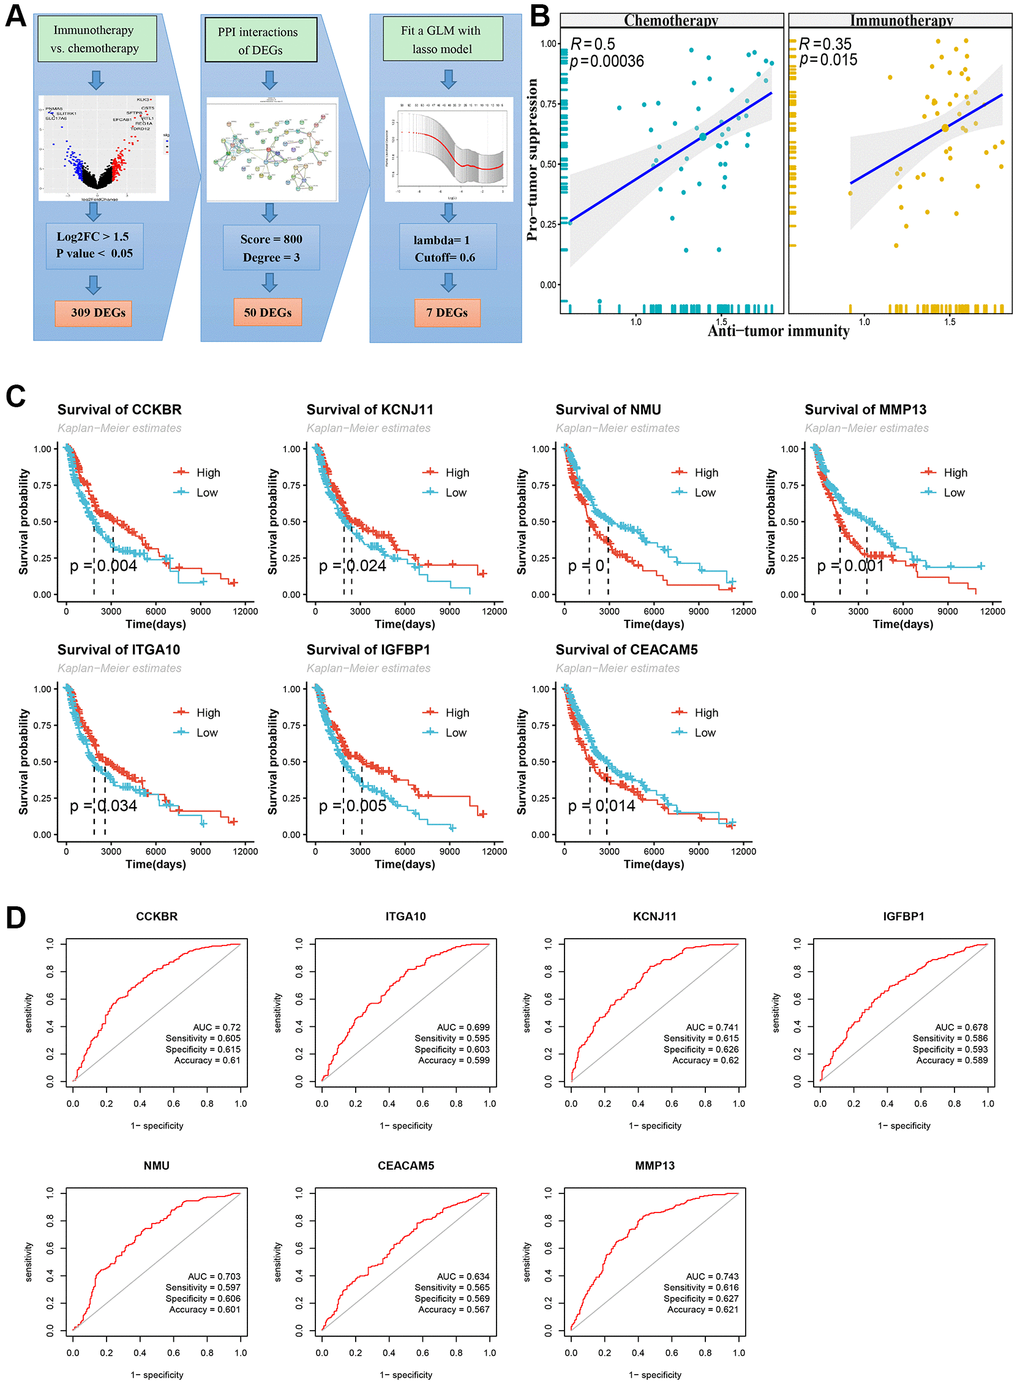
Figure 2.Flowchart of screening signature genes and its Kaplan-Meier survival curve and receiver operating characteristic curve (ROC). (A) Flowchart of screening signature genes. Including volcano plot of differentially expressed genes (DEGs), DEGs’ PPI network and Lasso-COX fitting model. (B) DEGs immune cell infiltration analysis, Pearson correlation test of Anti-tumor and Pro-tumor suppression based on immune cell type enrichment scores. (C) Log-rank test for survival curves of signature genes. (D) ROC curve, area under curve (AUC), sensitivity, specificity and accuracy values of signature genes.