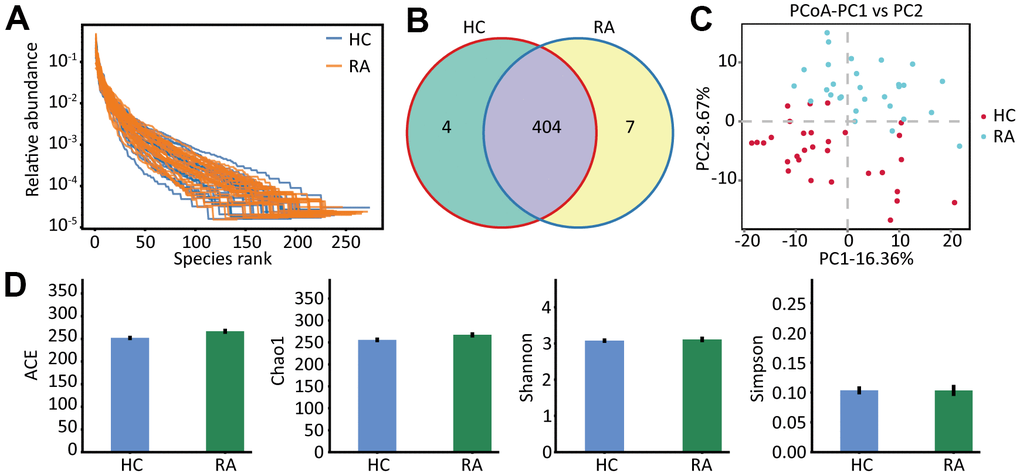
Figure 1.The species abundance and diversity. (A) The rank abundance curve of HC and RA group. (B) The OTUs (97% similarity) of HC and RA group. (C) The principal coordinate analysis score (PcoA) plots base on the relative abundance of OTUs, unweighted unifrac PcoA plots between HC group and RA group. HC group showed in red dots, RA group showed in blue dots. (D) Species α-diversity differences between the HC group and RA group (ACE, Chao1, Shannon and Simpson index).