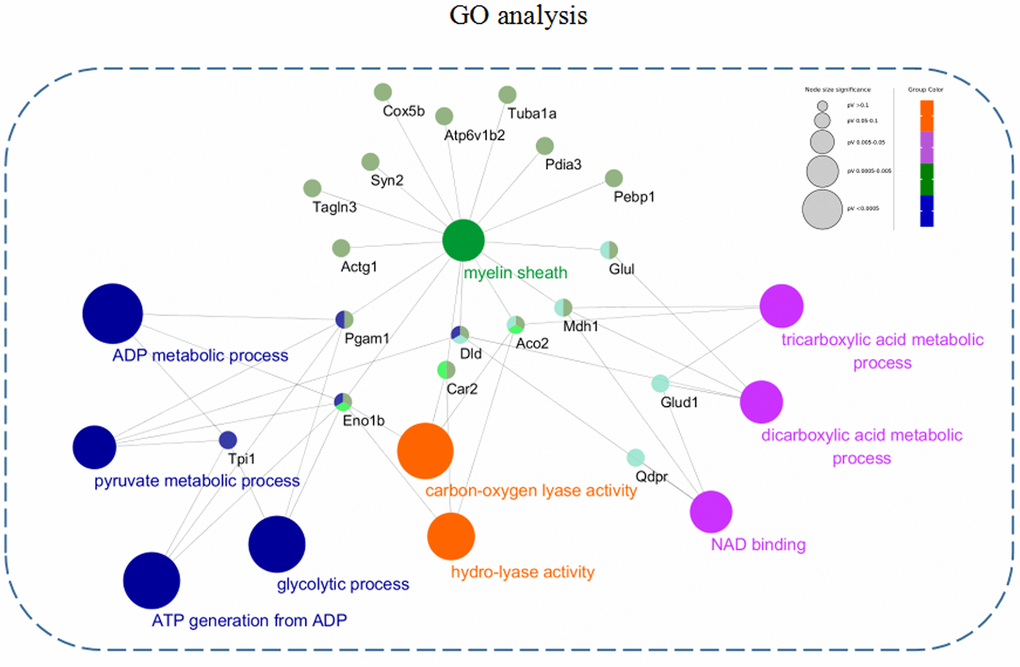
Figure 5.GO annotation enrichment analysis. The differentially expressed proteins from the 3xTg-AD mice treated with loganin compared with the control mice were enriched in BP, MF, and CC through a Cytoscape plug-in ClueGo. Different colour represented main classification of GO enrichment, and the bigger the circle changed, the better the enrichment.