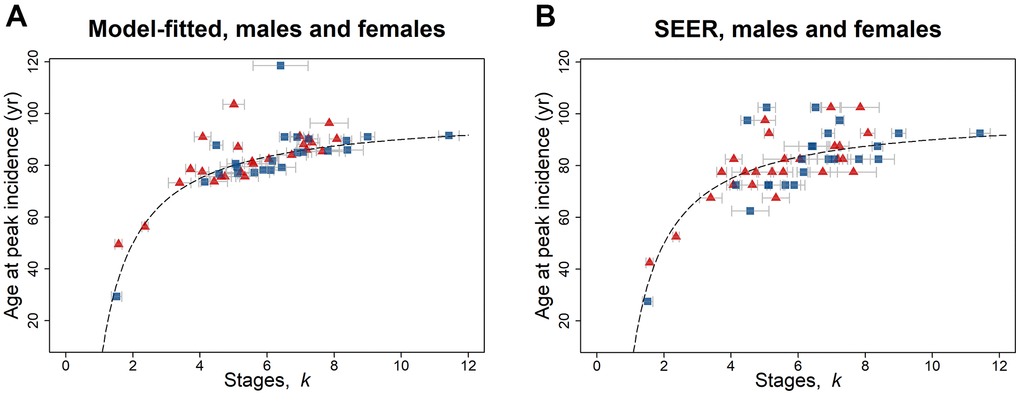
Figure 1.Age at peak incidence (years) versus number of stages k for SEER data for 2010–2013, for males (blue squares) and females (red triangles) and for both reproductive and non-reproductive cancers (Table 1A, 1B). Both (A) model-fitted and (B) SEER age at peak incidence have a highly significant positive association with k. The dashed line indicates the peak incidence age given by Equation 7 with b = 0.01. The gray bars indicate one standard error in the estimate of k.