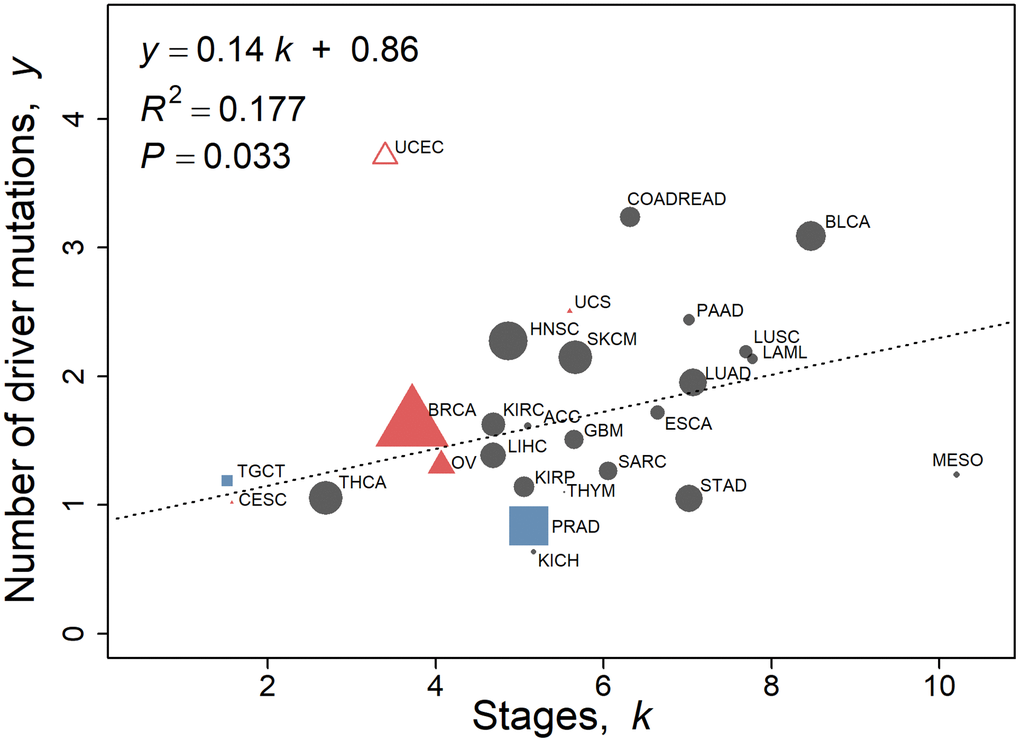
Figure 4.Number of driver mutations as assessed by Iranzo et al. [14] with respect to stage k calculated using the multistage-beta model employing the 2010–2013 SEER data. Values of non-reproductive cancers for both sexes pooled (Table 1C, n = 20) are represented by black circles. Female-specific cancers BRCA, CESC, OV, UCEC, and UCS are represented by red triangles, and male specific cancers PRAD and TGCT are represented by blue squares. UCEC is omitted as an outlier (standardized residual ≥3.0). The linear regression fit to the data is y = 0.14 k + 0.86, where y is the number of driver mutations as assessed by Iranzo et al. [14]. The regression is not weighted. The size of the points is proportional to the number of TCGA cases of that cancer type for illustration only.
Figure 4 — Profound synchrony of age-specific incidence rates and tumor suppression for different cancer types as revealed by the multistage-senescence model of carcinogenesis | Aging