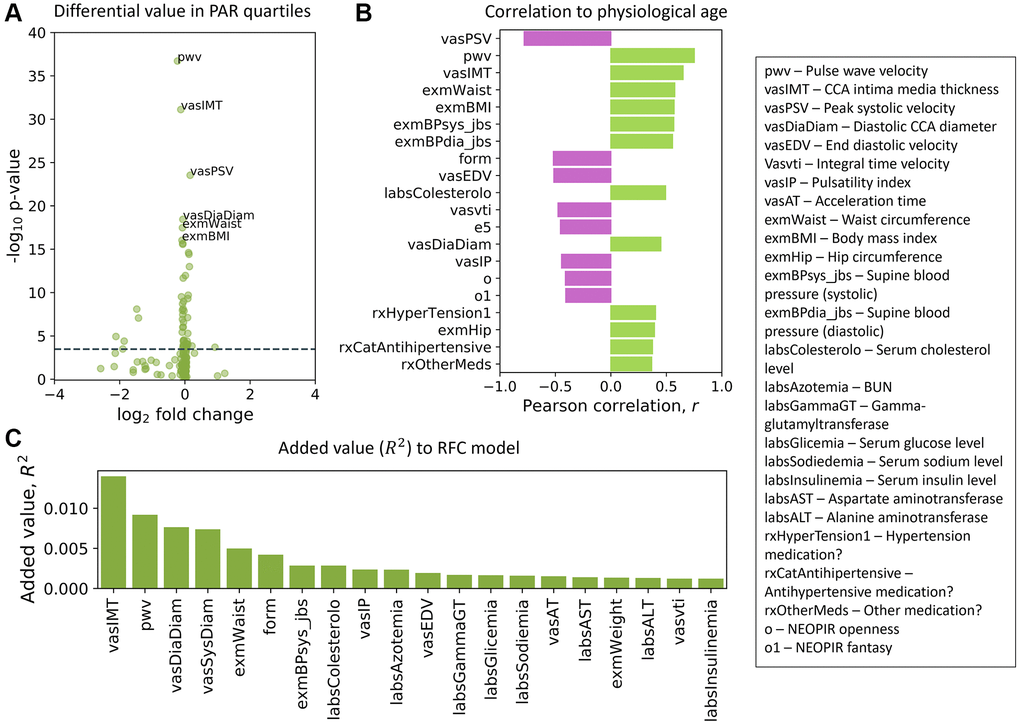
Figure 5.Top traits determined by three independent methods. (A) Volcano plot of the top traits in the full-trait model, which included pulse wave velocity (pwv), CCA intima media thickness (vasIMT), peak systolic velocity (vasPSV), diastolic CCA diameter (vasDiaDiam), waist circumference (exmWaist), and body mass index (exmBMI). Significant differences between the mean trait values of subjects in the top and bottom PAR quartiles were determined using a two-tailed students t-test on each trait. The dotted line corresponds to a Bonferroni-corrected threshold of p = 3.33 × 10⁻⁴ calculated from single-test threshold of p = 5.00 × 10⁻². Many top traits were also highly ranked in the common-trait model. (B) Traits rank-ordered by Pearson correlation (r) with physiological age measured using the full-trait RFC model. (C) Traits rank-ordered by approximate added value (R2) for the full-trait RFC model in SardiNIA (R2 = 0.858 with all traits used in model). Added value (R2) was averaged over 500 training-testing iterates for each trait. There was significant overlap in the highest ranked traits across all three scoring methods and between the common-trait and full-trait models (see Supplementary Materials). Trait names are as they appear in the SardiNIA study; descriptions of all traits are available in the Supplementary Materials.
Figure 5 — Predicting physiological aging rates from a range of quantitative traits using machine learning | Aging