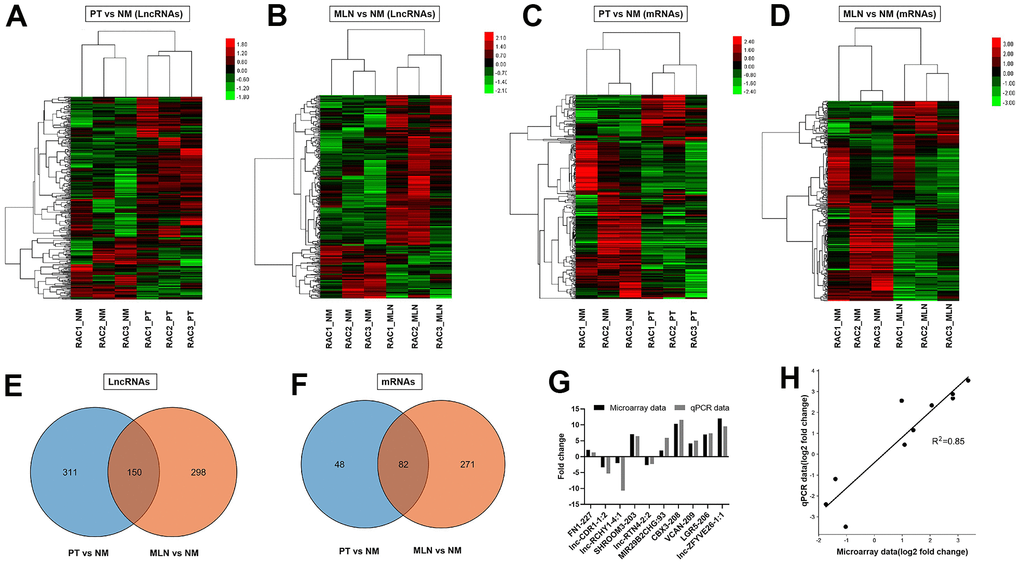
Figure 1.Differential expression analysis of lncRNAs and mRNAs in CRC. (A) Hierarchical cluster analysis of differentially expressed lncRNAs in primary tumor (PT) versus normal colorectal mucosa tissue (NM). (B) Hierarchical cluster analysis of differentially expressed lncRNAs in metastatic lymph nodes (MLNs) versus NM. (C) Hierarchical cluster analysis of differentially expressed mRNAs in PT versus NM. (D) Hierarchical cluster analysis of differentially expressed mRNAs in MLN versus NM. Venn diagrams showing the numbers of differentially expressed lncRNAs (E, F) in MLNs compared with those in PTs. (G) Verification of microarray data using qRT-PCR (H) Correlation analysis of gene expression between microarray data and qRT-PCR data. Microarray data were plotted against data from quantitative real-time PCR. Both the x -and y-axes were shown on a log2 scale. R2 indicates the square of the correlation coefficient.